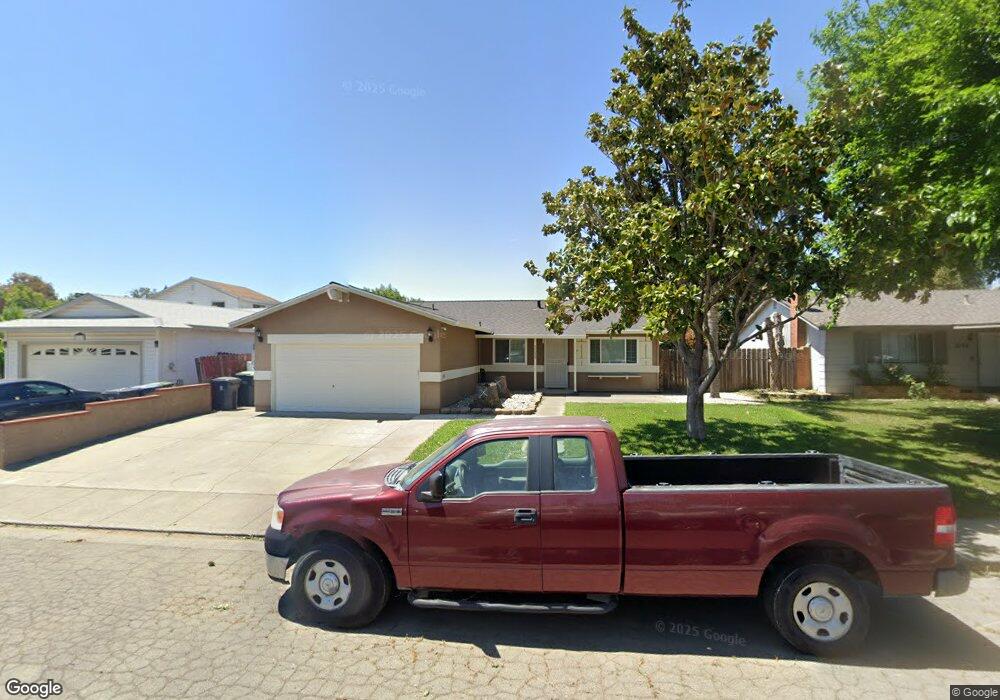
2125 Allston Place Fairfield, CA 94533
Estimated Value: $481,000 - $540,000
4
Beds
2
Baths
1,456
Sq Ft
$354/Sq Ft
Est. Value
About This Home
This home is located at 2125 Allston Place, Fairfield, CA 94533 and is currently estimated at $515,373, approximately $353 per square foot. 2125 Allston Place is a home located in Solano County with nearby schools including Tolenas Academy of Music & Media, Grange Middle School, and Fairfield High School.
Ownership History
Date
Name
Owned For
Owner Type
Purchase Details
Closed on
Jun 19, 2015
Sold by
Silveyra Sergio
Bought by
Anderson Richard A and Anderson Stacy L
Current Estimated Value
Home Financials for this Owner
Home Financials are based on the most recent Mortgage that was taken out on this home.
Original Mortgage
$265,109
Outstanding Balance
$208,930
Interest Rate
4.25%
Mortgage Type
FHA
Estimated Equity
$306,443
Purchase Details
Closed on
Aug 26, 2002
Sold by
Nauss Donald
Bought by
Silveyra Sergio
Home Financials for this Owner
Home Financials are based on the most recent Mortgage that was taken out on this home.
Original Mortgage
$224,100
Interest Rate
6.29%
Purchase Details
Closed on
Aug 13, 1998
Sold by
Donald Nauss
Bought by
Nauss Donald and Nauss Jacqueline Doris
Create a Home Valuation Report for This Property
The Home Valuation Report is an in-depth analysis detailing your home's value as well as a comparison with similar homes in the area
Home Values in the Area
Average Home Value in this Area
Purchase History
| Date | Buyer | Sale Price | Title Company |
|---|---|---|---|
| Anderson Richard A | $273,000 | Placer Title Company | |
| Silveyra Sergio | $249,000 | Frontier Title Company | |
| Nauss Donald | -- | -- |
Source: Public Records
Mortgage History
| Date | Status | Borrower | Loan Amount |
|---|---|---|---|
| Open | Anderson Richard A | $265,109 | |
| Previous Owner | Silveyra Sergio | $224,100 |
Source: Public Records
Tax History Compared to Growth
Tax History
| Year | Tax Paid | Tax Assessment Tax Assessment Total Assessment is a certain percentage of the fair market value that is determined by local assessors to be the total taxable value of land and additions on the property. | Land | Improvement |
|---|---|---|---|---|
| 2025 | $3,715 | $331,666 | $84,124 | $247,542 |
| 2024 | $3,715 | $325,164 | $82,475 | $242,689 |
| 2023 | $3,601 | $318,789 | $80,858 | $237,931 |
| 2022 | $3,557 | $312,539 | $79,273 | $233,266 |
| 2021 | $3,522 | $306,412 | $77,719 | $228,693 |
| 2020 | $3,403 | $300,005 | $76,923 | $223,082 |
| 2019 | $3,320 | $294,123 | $75,415 | $218,708 |
| 2018 | $3,427 | $288,357 | $73,937 | $214,420 |
| 2017 | $3,268 | $282,704 | $72,488 | $210,216 |
| 2016 | $3,242 | $277,162 | $71,067 | $206,095 |
| 2015 | $2,685 | $249,000 | $52,000 | $197,000 |
| 2014 | $2,580 | $237,000 | $52,000 | $185,000 |
Source: Public Records
Map
Nearby Homes
- 2049 Harte Ct
- 66 Villa Cir
- 2056 Davis Dr
- 2092 Kingfisher Way
- 2350 Gull Ct
- 1109 Sanderling Dr
- 1920 Grande Cir Unit 92
- 1970 Grande Cir Unit 20
- 1116 Gannet Ct
- 2120 Merritt Place
- 1940 Grande Cir Unit 13
- 1960 Grande Cir Unit 41
- 1030 Meadowlark Dr
- 126 Chevy Chase Ct
- 1941 Grande Cir Unit 54
- 1941 Grande Cir Unit 45
- 120 Century Ct
- 1328 Horizon Cir
- 1012 Tanager Ln
- 1461 Festival Ln
- 2117 Allston Place
- 2133 Allston Place
- 1380 Sanderling Dr
- 1374 Sanderling Dr
- 2109 Allston Place
- 1386 Sanderling Dr
- 2141 Allston Place
- 2112 Allston Place
- 1368 Sanderling Dr
- 1392 Sanderling Dr
- 2120 Allston Place
- 2149 Allston Place
- 2128 Allston Place
- 2101 Allston Place
- 1402 Meadowlark Dr
- 1362 Sanderling Dr
- 2136 Allston Place
- 1398 Sanderling Dr
- 2157 Allston Place
- 1408 Meadowlark Dr