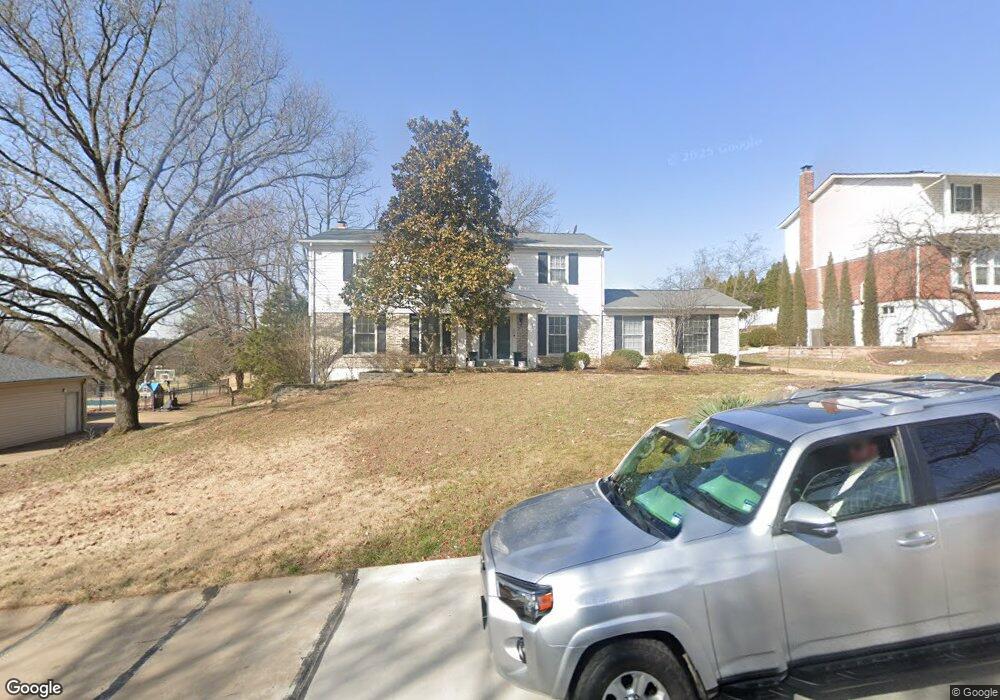
2125 Bonroyal Dr Saint Louis, MO 63131
Estimated Value: $544,337 - $737,000
4
Beds
3
Baths
2,436
Sq Ft
$255/Sq Ft
Est. Value
About This Home
This home is located at 2125 Bonroyal Dr, Saint Louis, MO 63131 and is currently estimated at $620,084, approximately $254 per square foot. 2125 Bonroyal Dr is a home located in St. Louis County with nearby schools including Barretts Elementary School, Parkway South Middle School, and Parkway South High School.
Ownership History
Date
Name
Owned For
Owner Type
Purchase Details
Closed on
Jan 24, 2019
Sold by
Ames David P and Ames Katherine F
Bought by
Ames David P and Ames Katherine F
Current Estimated Value
Home Financials for this Owner
Home Financials are based on the most recent Mortgage that was taken out on this home.
Original Mortgage
$65,000
Outstanding Balance
$49,533
Interest Rate
4.6%
Mortgage Type
Stand Alone Second
Estimated Equity
$570,551
Purchase Details
Closed on
Jun 8, 2017
Sold by
Behrens Gary L
Bought by
Ames David P and Siegfried Katherine F
Home Financials for this Owner
Home Financials are based on the most recent Mortgage that was taken out on this home.
Original Mortgage
$288,000
Outstanding Balance
$239,556
Interest Rate
4.02%
Mortgage Type
New Conventional
Estimated Equity
$380,528
Purchase Details
Closed on
Jul 23, 2001
Sold by
Behrens Gary L and Behrens Lorraine C
Bought by
Behrens Gary L and Behrens Lorraine C
Create a Home Valuation Report for This Property
The Home Valuation Report is an in-depth analysis detailing your home's value as well as a comparison with similar homes in the area
Home Values in the Area
Average Home Value in this Area
Purchase History
| Date | Buyer | Sale Price | Title Company |
|---|---|---|---|
| Ames David P | -- | Old Republic Natl Ttl Ins Co | |
| Ames David P | $360,000 | Us Title Main | |
| Behrens Gary L | -- | -- |
Source: Public Records
Mortgage History
| Date | Status | Borrower | Loan Amount |
|---|---|---|---|
| Open | Ames David P | $65,000 | |
| Open | Ames David P | $288,000 |
Source: Public Records
Tax History Compared to Growth
Tax History
| Year | Tax Paid | Tax Assessment Tax Assessment Total Assessment is a certain percentage of the fair market value that is determined by local assessors to be the total taxable value of land and additions on the property. | Land | Improvement |
|---|---|---|---|---|
| 2025 | $4,288 | $85,830 | $48,110 | $37,720 |
| 2024 | $4,288 | $76,250 | $26,960 | $49,290 |
| 2023 | $4,226 | $76,250 | $26,960 | $49,290 |
| 2022 | $4,111 | $67,390 | $26,960 | $40,430 |
| 2021 | $4,077 | $67,390 | $26,960 | $40,430 |
| 2020 | $4,262 | $67,390 | $26,750 | $40,640 |
| 2019 | $4,203 | $67,390 | $26,750 | $40,640 |
| 2018 | $3,838 | $56,850 | $19,950 | $36,900 |
| 2017 | $3,786 | $56,850 | $19,950 | $36,900 |
| 2016 | $3,844 | $54,870 | $18,050 | $36,820 |
| 2015 | $4,050 | $54,870 | $18,050 | $36,820 |
| 2014 | $3,413 | $50,160 | $12,860 | $37,300 |
Source: Public Records
Map
Nearby Homes
- 2211 Viewroyal Dr
- 2300 E Royal Ct
- 2527 Barrett Place Dr
- 2405 Fairoyal Dr
- 13112 Thornhill Dr
- 1824 Topping Rd
- 12841 Thornhill Ct
- 1603 Forestview Ridge Ln
- 13354 Thornhill Dr
- 1878 Ridgeview Circle Dr
- 1848 Ridgeview Circle Dr
- 13124 Huntercreek Ridge Rd
- 12213 Brook Springs Ct
- 1826 S Mason Rd
- 1515 Topping Rd
- 13156 Dougherty Ridge Ct
- 614 Carman Forest Ln
- 2145 Trailcrest Dr
- 12819 Huntercreek Rd
- 918 N Ballas Rd
- 2119 Bonroyal Dr
- 2133 Bonroyal Dr
- 2124 Bonroyal Dr
- 2130 Bonroyal Dr
- 2111 Bonroyal Dr
- 2139 Bonroyal Dr
- 2118 Bonroyal Dr
- 2136 Bonroyal Dr
- 2106 Bonroyal Dr
- 2175 Pardoroyal Dr
- 2181 Pardoroyal Dr
- 2105 Bonroyal Dr
- 2145 Bonroyal Dr
- 2144 Bonroyal Dr
- 2167 Pardoroyal Dr
- 2187 Pardoroyal Dr
- 13277 Bonroyal Dr
- 13272 Bonroyal Dr
- 2193 Pardoroyal Dr
- 2150 Bonroyal Dr