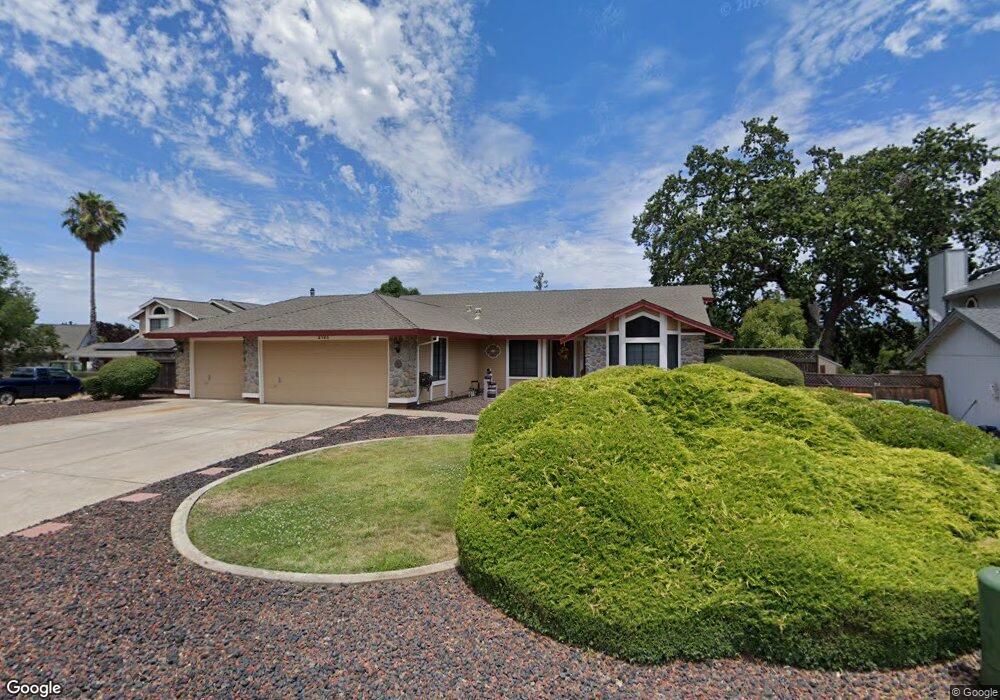
2125 Carrillo Ct Cameron Park, CA 95682
Estimated Value: $592,000 - $653,341
4
Beds
2
Baths
1,984
Sq Ft
$319/Sq Ft
Est. Value
About This Home
This home is located at 2125 Carrillo Ct, Cameron Park, CA 95682 and is currently estimated at $632,085, approximately $318 per square foot. 2125 Carrillo Ct is a home located in El Dorado County with nearby schools including Camerado Springs Middle School, Ponderosa High School, and Buckeye Union Mandarin Immersion Charter School.
Ownership History
Date
Name
Owned For
Owner Type
Purchase Details
Closed on
Feb 3, 2017
Sold by
Leary Paul D O and Leary Georgina M O
Bought by
Leary Paul D O and Leary Georgina M O
Current Estimated Value
Purchase Details
Closed on
Dec 27, 2010
Sold by
Oleary Georgina M
Bought by
Oleary Paul and Oleary Georgina M
Home Financials for this Owner
Home Financials are based on the most recent Mortgage that was taken out on this home.
Original Mortgage
$180,000
Outstanding Balance
$121,776
Interest Rate
4.62%
Mortgage Type
New Conventional
Estimated Equity
$510,309
Purchase Details
Closed on
Oct 18, 2010
Sold by
Frizza Raymond and The Beatrice M Frizza Trust
Bought by
Frizza Raymond and Oleary Georgina M
Purchase Details
Closed on
Sep 16, 1996
Sold by
Frizza Beatrice M
Bought by
Frizza Beatrice M and Beatrice M Frizza Trust
Create a Home Valuation Report for This Property
The Home Valuation Report is an in-depth analysis detailing your home's value as well as a comparison with similar homes in the area
Home Values in the Area
Average Home Value in this Area
Purchase History
| Date | Buyer | Sale Price | Title Company |
|---|---|---|---|
| Leary Paul D O | -- | None Available | |
| Oleary Paul | -- | Placer Title Company | |
| Oleary Georgina M | $150,000 | Placer Title Company | |
| Frizza Raymond | -- | Accommodation | |
| Frizza Beatrice M | -- | -- |
Source: Public Records
Mortgage History
| Date | Status | Borrower | Loan Amount |
|---|---|---|---|
| Open | Oleary Paul | $180,000 |
Source: Public Records
Tax History
| Year | Tax Paid | Tax Assessment Tax Assessment Total Assessment is a certain percentage of the fair market value that is determined by local assessors to be the total taxable value of land and additions on the property. | Land | Improvement |
|---|---|---|---|---|
| 2025 | $3,504 | $322,867 | $90,468 | $232,399 |
| 2024 | $3,504 | $316,538 | $88,695 | $227,843 |
| 2023 | $3,439 | $310,332 | $86,956 | $223,376 |
| 2022 | $3,390 | $304,248 | $85,251 | $218,997 |
| 2021 | $3,348 | $298,283 | $83,580 | $214,703 |
| 2020 | $3,304 | $295,225 | $82,723 | $212,502 |
| 2019 | $3,250 | $289,437 | $81,101 | $208,336 |
| 2018 | $3,169 | $283,762 | $79,511 | $204,251 |
| 2017 | $3,181 | $278,199 | $77,952 | $200,247 |
| 2016 | $3,149 | $272,745 | $76,424 | $196,321 |
| 2015 | $3,059 | $268,650 | $75,277 | $193,373 |
| 2014 | $3,059 | $263,389 | $73,803 | $189,586 |
Source: Public Records
Map
Nearby Homes
- 2527 Rosales St
- 3477 Covello Cir
- 3445 Covello Cir
- 2560 Solano Rd
- 2406 Knollwood Dr
- 4683 Abrijo Rd
- 2575 Meadow Ln Unit 8
- 2515 Merrychase Dr Unit K
- 2515 Merrychase Dr Unit F
- 3831 Sheridan Rd
- 3629 Chelsea Rd
- 4285 Crazy Horse Rd
- 0 Crazy Horse Rd
- 3020 Oakwood Rd
- 3004 Tierra de Dios Dr
- 3098 Oakwood Rd
- 3691 Hampton Ln
- 2717 Knollwood Dr
- 7850 Stone Ranch Dr
- 7878 Stone Ranch Dr
- 2133 Carrillo Ct
- 2119 Carrillo Ct
- 4740 Castana Dr
- 4750 Castana Dr
- 2128 Carrillo Ct
- 2124 Carrillo Ct
- 2134 Carrillo Ct
- 4728 Castana Dr
- 2116 Carrillo Ct
- 3240 Terraza St
- 2118 Carrillo Ct
- 2521 Rosales St
- 3246 Terraza St
- 3232 Terraza St
- 4722 Castana Dr
- 3256 Terraza St
- 3226 Terraza St
- 2535 Rosales St
- 3493 Montero Rd
- 4749 Castana Dr
Your Personal Tour Guide
Ask me questions while you tour the home.