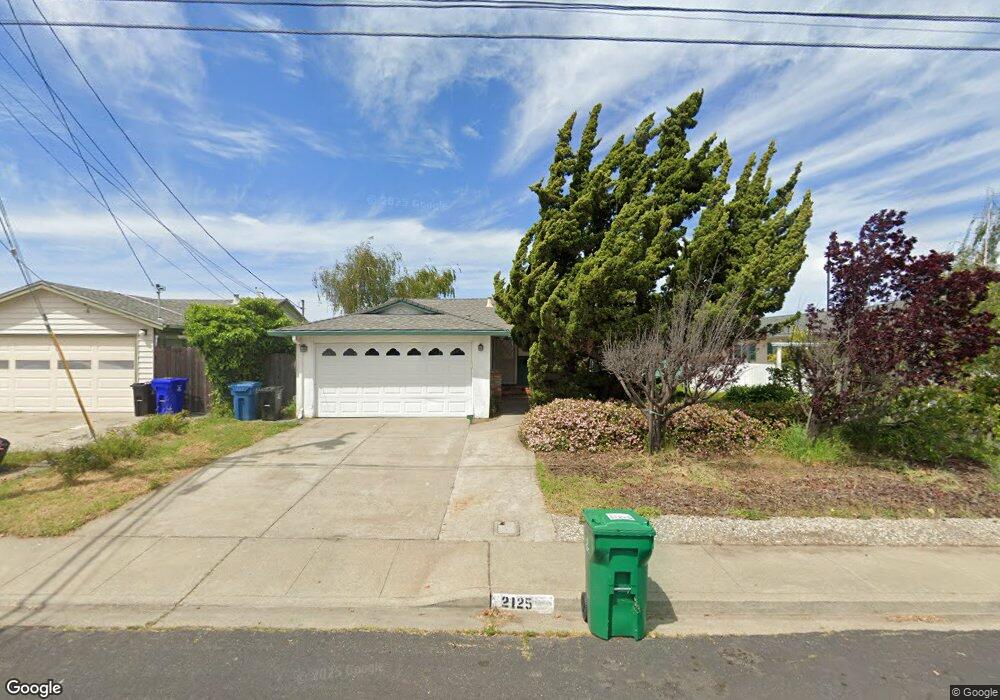
2125 Cypress Ave San Pablo, CA 94806
Gateley NeighborhoodEstimated Value: $615,000 - $702,000
3
Beds
2
Baths
1,204
Sq Ft
$539/Sq Ft
Est. Value
About This Home
This home is located at 2125 Cypress Ave, San Pablo, CA 94806 and is currently estimated at $649,490, approximately $539 per square foot. 2125 Cypress Ave is a home located in Contra Costa County with nearby schools including Shannon Elementary School, Pinole Middle School, and Pinole Valley High School.
Ownership History
Date
Name
Owned For
Owner Type
Purchase Details
Closed on
Aug 10, 2022
Sold by
Yousef Abukhdair
Bought by
Ycla Llc
Current Estimated Value
Home Financials for this Owner
Home Financials are based on the most recent Mortgage that was taken out on this home.
Original Mortgage
$574,000
Outstanding Balance
$549,591
Interest Rate
5.7%
Estimated Equity
$99,899
Purchase Details
Closed on
Jun 18, 2021
Sold by
Olivier David
Bought by
Ycla Llc
Home Financials for this Owner
Home Financials are based on the most recent Mortgage that was taken out on this home.
Original Mortgage
$544,500
Interest Rate
2.9%
Mortgage Type
Commercial
Purchase Details
Closed on
Jul 19, 2019
Sold by
Dotson Mark
Bought by
Dotson Mark Brian and Dotson Shelley Ann
Purchase Details
Closed on
Aug 12, 2004
Sold by
Dotson J C and Dotson Frieda W
Bought by
Dotson J C and Dotson Frieda W
Create a Home Valuation Report for This Property
The Home Valuation Report is an in-depth analysis detailing your home's value as well as a comparison with similar homes in the area
Home Values in the Area
Average Home Value in this Area
Purchase History
| Date | Buyer | Sale Price | Title Company |
|---|---|---|---|
| Ycla Llc | -- | Fidelity National Title | |
| Abukhdair Yousef | -- | Fidelity National Title | |
| Ycla Llc | $605,000 | Old Republic Title Company | |
| Ouvier David | $550,000 | Old Republic Title Company | |
| Dotson Mark Brian | -- | None Available | |
| Dotson Mark | -- | None Available | |
| Dotson J C | -- | -- |
Source: Public Records
Mortgage History
| Date | Status | Borrower | Loan Amount |
|---|---|---|---|
| Open | Abukhdair Yousef | $574,000 | |
| Closed | Ycla Llc | $574,000 | |
| Previous Owner | Ycla Llc | $544,500 |
Source: Public Records
Tax History Compared to Growth
Tax History
| Year | Tax Paid | Tax Assessment Tax Assessment Total Assessment is a certain percentage of the fair market value that is determined by local assessors to be the total taxable value of land and additions on the property. | Land | Improvement |
|---|---|---|---|---|
| 2025 | $9,302 | $654,868 | $456,784 | $198,084 |
| 2024 | $9,106 | $642,028 | $447,828 | $194,200 |
| 2023 | $9,106 | $629,441 | $439,048 | $190,393 |
| 2022 | $8,985 | $617,100 | $430,440 | $186,660 |
| 2021 | $1,826 | $64,709 | $22,380 | $42,329 |
| 2019 | $1,564 | $62,791 | $21,717 | $41,074 |
| 2018 | $1,474 | $61,561 | $21,292 | $40,269 |
| 2017 | $1,404 | $60,355 | $20,875 | $39,480 |
| 2016 | $1,337 | $59,172 | $20,466 | $38,706 |
| 2015 | $1,293 | $58,284 | $20,159 | $38,125 |
| 2014 | $1,289 | $57,144 | $19,765 | $37,379 |
Source: Public Records
Map
Nearby Homes
- 2071 Cypress Ave
- 2036 Dublin Dr
- 2275 Meadowlark St
- 703 Waterford Place
- 603 Waterford Place Unit 603
- 506 Dursey Dr
- 205 Dursey Dr Unit 205
- 16401 San Pablo Ave Unit 102
- 16401 San Pablo Ave Unit 114
- 16401 San Pablo Ave Unit 125
- 16401 San Pablo Ave Unit 142
- 16401 San Pablo Ave Unit 275
- 16401 San Pablo Ave Unit 274
- 2575 Kevin Rd
- 528 Dohrmann Ln
- 91 Bonnie Dr
- 2570 Brian Rd
- 38 Nancy Dr
- 0 Shamrock Dr
- 815 San Pablo Ave
- 2119 Cypress Ave
- 2131 Cypress Ave
- 2137 Cypress Ave
- 2115 Cypress Ave
- 2116 Broadmore Ave
- 2107 Cypress Ave
- 2143 Cypress Ave
- 2132 Cypress Ave
- 2138 Cypress Ave
- 2122 Broadmore Ave
- 2101 Cypress Ave
- 2149 Cypress Ave
- 2144 Cypress Ave
- 2119 Birch Ct
- 2128 Broadmore Ave
- 2137 Broadmore Ave
- 2095 Cypress Ave
- 2155 Cypress Ave
- 2150 Cypress Ave
- 2134 Broadmore Ave