S
Landlord's Agent in 2016
Sonja Dallas
Towne Realty
(334) 467-8107
2 in this area
12 Total Sales
Estimated Value: $206,000 - $229,000
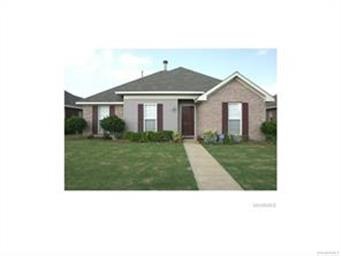
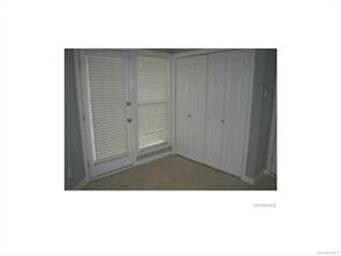
Adorable 3 Bedroom 2 bath home located in desireable Halcyon Down neighborhood located a short distance to Eastchase and
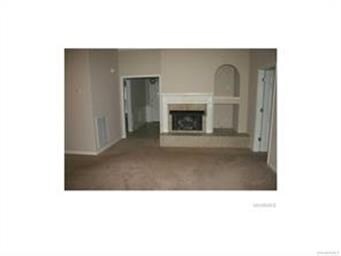
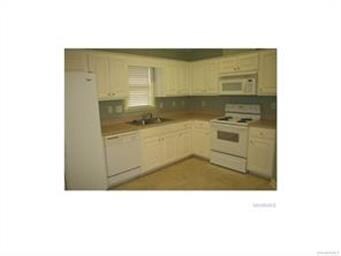
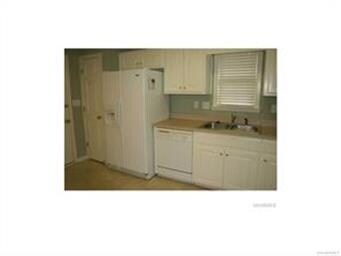
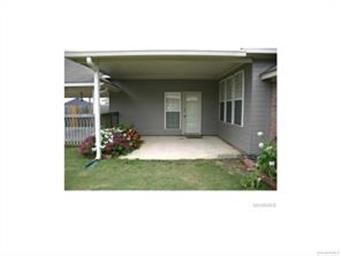
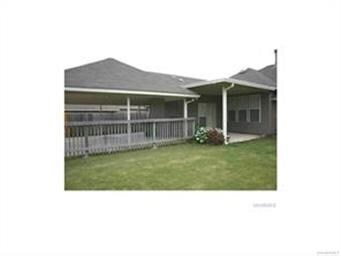
I-85. This home offers alot of great features. Den is very spacious and featrures large windows and gas fireplace. Kitchen is spacious and features lots of cabinets space, built in microwave and pantry. Master bedroom is large and features large window. Master bathroom features a garden tub/shower and very large walk-in closet. The other two bedrooms, located in the front of the house are a nice size. The hall full bathroom is a nice size and features a tub/shower combination. You will love relaxing on the covered patio and cute fenced backyard.
This home will be available February 1, 2017, Owner currently resides in home MUST make an appointment 48 hours in advance.
| Date | Buyer | Sale Price | Title Company |
|---|---|---|---|
| Johnson Carroll Jeffrey L | $139,920 | -- | |
| Real Kathy G | -- | -- |
| Date | Status | Borrower | Loan Amount |
|---|---|---|---|
| Open | Johnson Carroll Jeffrey L | $111,920 |
| Date | Event | Price | List to Sale | Price per Sq Ft |
|---|---|---|---|---|
| 12/01/2016 12/01/16 | Rented | $1,050 | -4.5% | -- |
| 12/01/2016 12/01/16 | For Rent | $1,100 | -- | -- |
| Year | Tax Paid | Tax Assessment Tax Assessment Total Assessment is a certain percentage of the fair market value that is determined by local assessors to be the total taxable value of land and additions on the property. | Land | Improvement |
|---|---|---|---|---|
| 2025 | $727 | $20,560 | $3,750 | $16,810 |
| 2024 | $954 | $20,280 | $3,750 | $16,530 |
| 2023 | $954 | $19,430 | $3,750 | $15,680 |
| 2022 | $568 | $16,670 | $3,750 | $12,920 |
| 2021 | $516 | $15,260 | $0 | $0 |
| 2020 | $521 | $15,390 | $3,750 | $11,640 |
| 2019 | $504 | $14,930 | $3,750 | $11,180 |
| 2018 | $517 | $14,140 | $3,750 | $10,390 |
| 2017 | $476 | $28,280 | $7,500 | $20,780 |
| 2014 | $494 | $14,640 | $3,750 | $10,890 |
| 2013 | -- | $14,900 | $3,750 | $11,150 |
S
Landlord's Agent in 2016
Sonja Dallas
Towne Realty
(334) 467-8107
2 in this area
12 Total Sales
Source: Montgomery Area Association of REALTORS®
MLS Number: 409849
APN: 09-04-20-4-000-001.040
Disclaimer: Certain information contained herein is derived from information provided by parties other than Homes.com. All information provided is deemed reliable, but is not guaranteed to be accurate and should be independently verified.
![]() Information is deemed reliable, but not guaranteed. Listing Information Copyright 2026 Multiple Listing Service, Inc. of Montgomery Area Association of REALTORS® Inc. The information being provided is for consumers' personal, non-commercial use and will not be used for any purpose other than to identify prospective properties consumers may be interested in purchasing. The data relating to real estate for sale on this web site comes in part from the IDX Program of the Multiple Listing Service, Inc. of Montgomery Area Association of REALTORS® Inc. Real estate listings held by brokerage firms other than Ten-X are governed by MLS Rules and Regulations and detailed information about them includes the name of the listing companies.
Information is deemed reliable, but not guaranteed. Listing Information Copyright 2026 Multiple Listing Service, Inc. of Montgomery Area Association of REALTORS® Inc. The information being provided is for consumers' personal, non-commercial use and will not be used for any purpose other than to identify prospective properties consumers may be interested in purchasing. The data relating to real estate for sale on this web site comes in part from the IDX Program of the Multiple Listing Service, Inc. of Montgomery Area Association of REALTORS® Inc. Real estate listings held by brokerage firms other than Ten-X are governed by MLS Rules and Regulations and detailed information about them includes the name of the listing companies.
Ask me questions while you tour the home.
