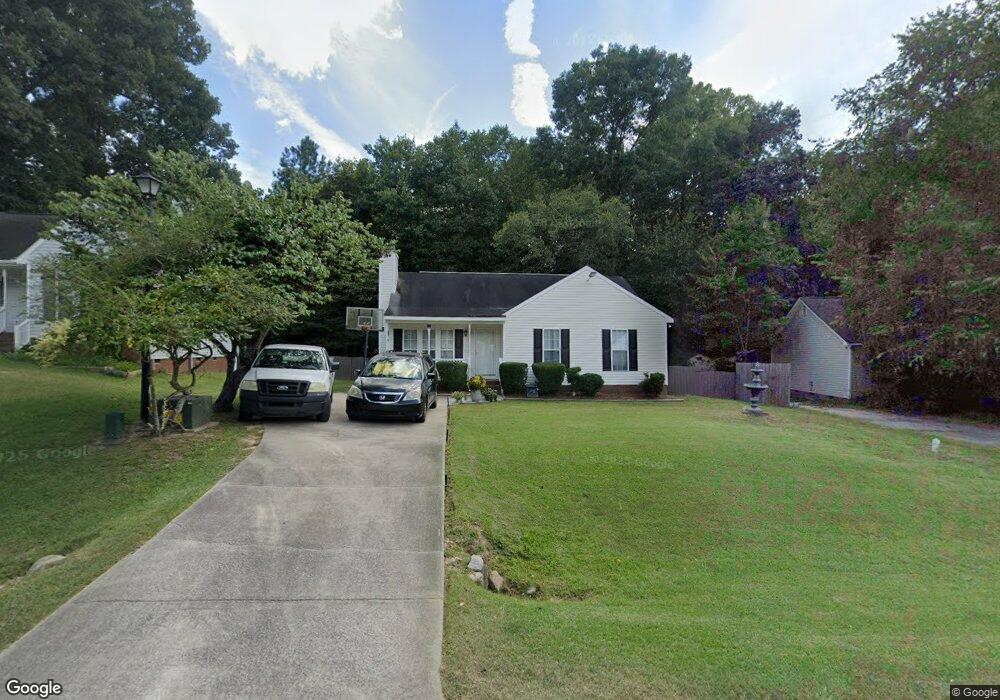
2125 Ruddy Rd Raleigh, NC 27616
Estimated Value: $279,301 - $296,000
3
Beds
2
Baths
1,184
Sq Ft
$243/Sq Ft
Est. Value
About This Home
This home is located at 2125 Ruddy Rd, Raleigh, NC 27616 and is currently estimated at $287,325, approximately $242 per square foot. 2125 Ruddy Rd is a home located in Wake County with nearby schools including Forestville Road Elementary School, Neuse River Middle School, and Knightdale High.
Ownership History
Date
Name
Owned For
Owner Type
Purchase Details
Closed on
Jun 20, 2002
Sold by
Hud
Bought by
Maduabuchukwu Boniface and Maduabuchukwu Chika
Current Estimated Value
Home Financials for this Owner
Home Financials are based on the most recent Mortgage that was taken out on this home.
Original Mortgage
$71,280
Outstanding Balance
$30,245
Interest Rate
6.86%
Estimated Equity
$257,080
Purchase Details
Closed on
Nov 12, 2001
Sold by
Shiner Michael P and Shiner Lili A
Bought by
Principal Residential Mtg Inc
Purchase Details
Closed on
Aug 27, 1998
Sold by
Ward Jonathan R
Bought by
Shiner Michael P and Connelly Lili A
Home Financials for this Owner
Home Financials are based on the most recent Mortgage that was taken out on this home.
Original Mortgage
$106,837
Interest Rate
6.92%
Mortgage Type
FHA
Create a Home Valuation Report for This Property
The Home Valuation Report is an in-depth analysis detailing your home's value as well as a comparison with similar homes in the area
Home Values in the Area
Average Home Value in this Area
Purchase History
| Date | Buyer | Sale Price | Title Company |
|---|---|---|---|
| Maduabuchukwu Boniface | -- | -- | |
| Principal Residential Mtg Inc | $113,470 | -- | |
| Shiner Michael P | $110,000 | Fidelity National Title Inc |
Source: Public Records
Mortgage History
| Date | Status | Borrower | Loan Amount |
|---|---|---|---|
| Open | Maduabuchukwu Boniface | $71,280 | |
| Previous Owner | Shiner Michael P | $106,837 |
Source: Public Records
Tax History Compared to Growth
Tax History
| Year | Tax Paid | Tax Assessment Tax Assessment Total Assessment is a certain percentage of the fair market value that is determined by local assessors to be the total taxable value of land and additions on the property. | Land | Improvement |
|---|---|---|---|---|
| 2025 | $1,680 | $259,459 | $80,000 | $179,459 |
| 2024 | $1,631 | $259,459 | $80,000 | $179,459 |
| 2023 | $1,336 | $168,730 | $35,000 | $133,730 |
| 2022 | $1,239 | $168,730 | $35,000 | $133,730 |
| 2021 | $1,206 | $168,730 | $35,000 | $133,730 |
| 2020 | $1,186 | $168,730 | $35,000 | $133,730 |
| 2019 | $1,087 | $130,645 | $38,000 | $92,645 |
| 2018 | $1,000 | $130,645 | $38,000 | $92,645 |
| 2017 | $949 | $130,645 | $38,000 | $92,645 |
| 2016 | $930 | $130,645 | $38,000 | $92,645 |
| 2015 | $890 | $125,250 | $28,000 | $97,250 |
| 2014 | $844 | $125,250 | $28,000 | $97,250 |
Source: Public Records
Map
Nearby Homes
- 4317 Snow Goose Ct
- 2028 Ruddy Rd
- 4457 Labrador Dr
- 4208 Bluewing Rd
- 4356 Coldwater Springs Dr
- 4348 Coldwater Springs Dr
- 4344 Coldwater Springs Dr
- 4345 Coldwater Springs Dr
- 4340 Coldwater Springs Dr
- 4004 Mount Moran Rd
- 7817 Elmshire Way
- 3917 Mount Moran Rd
- 4341 Coldwater Springs Dr
- 2108 Brilliant Dr
- 4332 Coldwater Springs Dr
- 7727 Weathered Oak Way
- 3932 Mount Moran Rd
- 7661 Mapleshire Dr
- 2616 Lizei St
- 7636 Birchmoor Way
- 2121 Ruddy Rd
- 2129 Ruddy Rd
- 2117 Ruddy Rd
- 2133 Ruddy Rd
- 2124 Ruddy Rd
- 4400 Whistling Way
- 2120 Ruddy Rd
- 2201 Ruddy Rd
- 4404 Whistling Way
- 2109 Ruddy Rd
- 4400 Canadian Ct
- 4317 Scaup Ct
- 4316 Scaup Ct
- 4405 Canadian Ct
- 2112 Ruddy Rd
- 2205 Ruddy Rd
- 4408 Whistling Way
- 4401 Whistling Way
- 2108 Ruddy Rd
- 4409 Canadian Ct