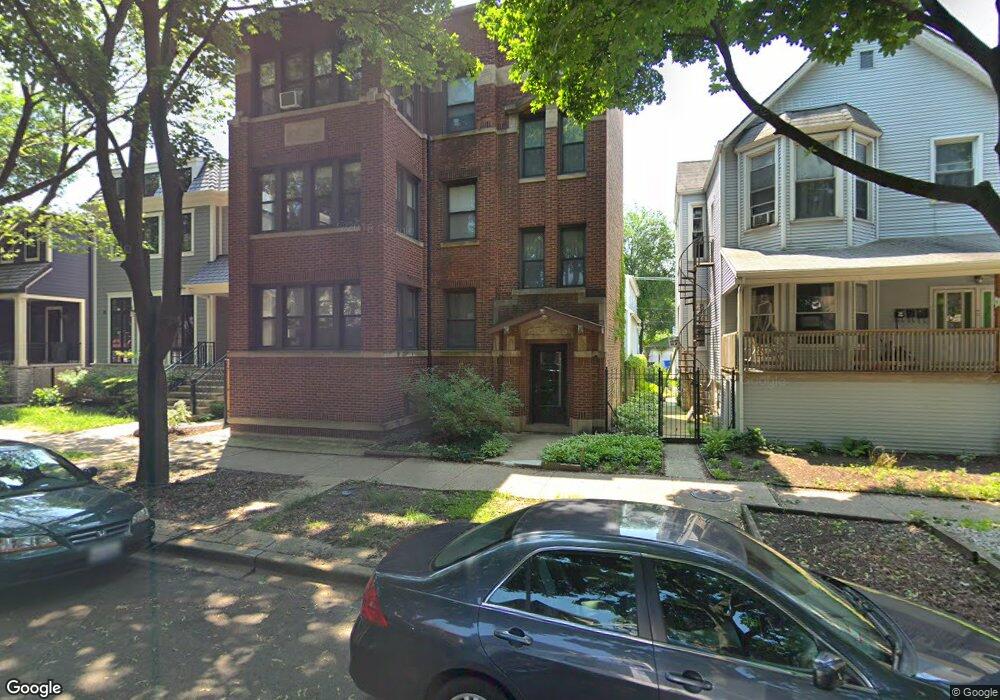
2125 W Eastwood Ave Chicago, IL 60625
Ravenswood NeighborhoodEstimated Value: $1,010,000 - $1,613,000
5
Beds
2
Baths
2,184
Sq Ft
$580/Sq Ft
Est. Value
About This Home
This home is located at 2125 W Eastwood Ave, Chicago, IL 60625 and is currently estimated at $1,266,298, approximately $579 per square foot. 2125 W Eastwood Ave is a home located in Cook County with nearby schools including McPherson Elementary School, Amundsen High School, and Lycee Francais de Chicago.
Ownership History
Date
Name
Owned For
Owner Type
Purchase Details
Closed on
Dec 21, 2000
Sold by
Lefly David W and Kirkey Lois S
Bought by
Lefly David W and Kirkey Lois S
Current Estimated Value
Purchase Details
Closed on
Oct 16, 2000
Sold by
Lefly David W and Kirkey Lois S
Bought by
Lefly David W and Kirkey Lois S
Purchase Details
Closed on
Aug 2, 1999
Sold by
Kirkey Lois Suzanne R
Bought by
Kirkey Lois Suzanne R and Lefly David W
Home Financials for this Owner
Home Financials are based on the most recent Mortgage that was taken out on this home.
Original Mortgage
$352,000
Interest Rate
7.7%
Purchase Details
Closed on
Jul 30, 1999
Sold by
Kirkey Hanford M and Kirkey Lois Suzanne R
Bought by
Kirkey Lois Suzanne R
Home Financials for this Owner
Home Financials are based on the most recent Mortgage that was taken out on this home.
Original Mortgage
$352,000
Interest Rate
7.7%
Create a Home Valuation Report for This Property
The Home Valuation Report is an in-depth analysis detailing your home's value as well as a comparison with similar homes in the area
Home Values in the Area
Average Home Value in this Area
Purchase History
| Date | Buyer | Sale Price | Title Company |
|---|---|---|---|
| Lefly David W | -- | -- | |
| Lefly David W | -- | -- | |
| Kirkey Lois Suzanne R | -- | Prairie Title | |
| Kirkey Lois Suzanne R | -- | Prairie Title |
Source: Public Records
Mortgage History
| Date | Status | Borrower | Loan Amount |
|---|---|---|---|
| Closed | Kirkey Lois Suzanne R | $352,000 |
Source: Public Records
Tax History Compared to Growth
Tax History
| Year | Tax Paid | Tax Assessment Tax Assessment Total Assessment is a certain percentage of the fair market value that is determined by local assessors to be the total taxable value of land and additions on the property. | Land | Improvement |
|---|---|---|---|---|
| 2024 | $22,372 | $121,000 | $50,922 | $70,078 |
| 2023 | $21,770 | $112,000 | $41,103 | $70,897 |
| 2022 | $21,770 | $112,000 | $41,103 | $70,897 |
| 2021 | $21,317 | $112,000 | $41,103 | $70,897 |
| 2020 | $12,142 | $60,089 | $21,921 | $38,168 |
| 2019 | $12,026 | $66,031 | $21,921 | $44,110 |
| 2018 | $11,822 | $66,031 | $21,921 | $44,110 |
| 2017 | $10,484 | $54,777 | $19,181 | $35,596 |
| 2016 | $10,114 | $54,777 | $19,181 | $35,596 |
| 2015 | $9,214 | $54,777 | $19,181 | $35,596 |
| 2014 | $10,394 | $60,425 | $14,614 | $45,811 |
| 2013 | $9,829 | $60,425 | $14,614 | $45,811 |
Source: Public Records
Map
Nearby Homes
- 2224 W Eastwood Ave
- 2163 W Windsor Ave
- 2034 W Sunnyside Ave
- 4814 N Damen Ave Unit 209
- 4726 N Winchester Ave Unit C
- 4845 N Leavitt St
- 4519 N Western Ave
- 4545 N Wolcott Ave Unit 1
- 2248 W Ainslie St
- 4906 N Winchester Ave
- 4751 N Artesian Ave Unit 205
- 4938 N Bell Ave
- 2321 W Montrose Ave
- 4333 N Oakley Ave
- 2455 W Leland Ave Unit 1
- 4948 N Winchester Ave
- 1949 W Argyle St Unit 19491
- 1907 W Montrose Ave Unit 2
- 4909 N Wolcott Ave Unit 2B
- 4745 N Ravenswood Ave Unit 210
- 2121 W Eastwood Ave
- 2129 W Eastwood Ave
- 2117 W Eastwood Ave
- 2131 W Eastwood Ave
- 2135 W Eastwood Ave
- 2113 W Eastwood Ave
- 4623 N Hamilton Ave Unit 1
- 4623 N Hamilton Ave
- 4623 N Hamilton Ave Unit 3
- 4617 N Hamilton Ave Unit 2
- 4617 N Hamilton Ave Unit 1
- 4617 N Hamilton Ave Unit 3
- 4625 N Hamilton Ave Unit 2
- 4625 N Hamilton Ave Unit 3
- 4625 N Hamilton Ave
- 4615 N Hamilton Ave Unit 2
- 4615 N Hamilton Ave Unit 1
- 4615 N Hamilton Ave
- 2124 W Wilson Ave
- 2120 W Wilson Ave