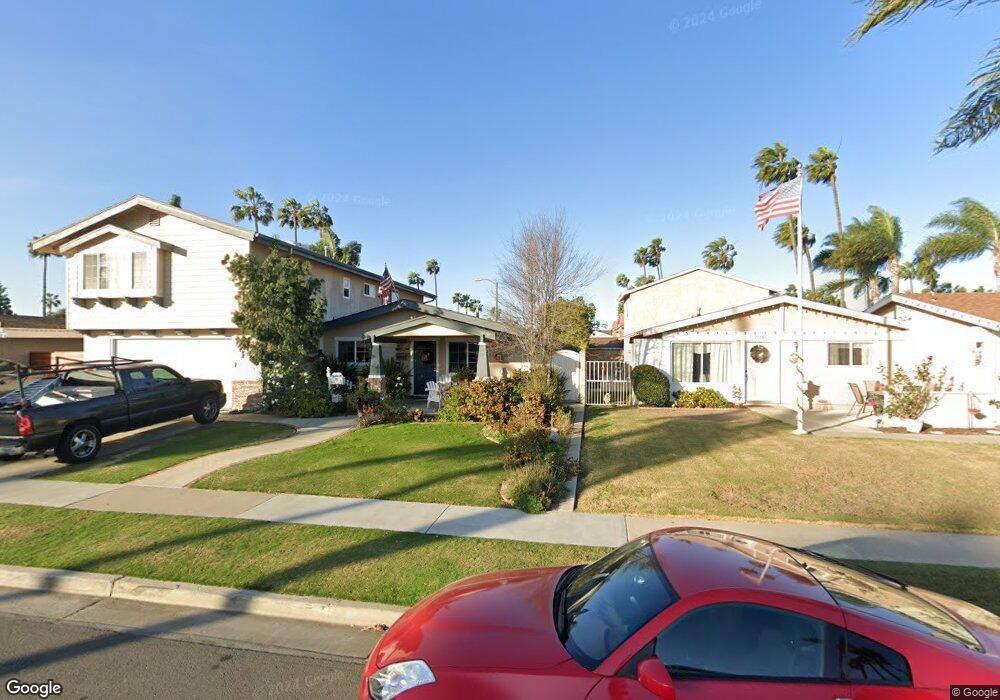
21251 Cupar Ln Huntington Beach, CA 92646
Southeast NeighborhoodEstimated Value: $1,664,000 - $2,097,000
5
Beds
4
Baths
2,649
Sq Ft
$694/Sq Ft
Est. Value
About This Home
This home is located at 21251 Cupar Ln, Huntington Beach, CA 92646 and is currently estimated at $1,839,523, approximately $694 per square foot. 21251 Cupar Ln is a home located in Orange County with nearby schools including S.A. Moffett Elementary School, Isaac L. Sowers Middle School, and Edison High School.
Ownership History
Date
Name
Owned For
Owner Type
Purchase Details
Closed on
Mar 20, 2013
Sold by
Nehrig Stephen E and Nehrig Francine M
Bought by
Nehrig Stephen Earl and Nehrig Francine Marie
Current Estimated Value
Purchase Details
Closed on
Mar 24, 2006
Sold by
Nehrig Stephen E and Nehrig Francine M
Bought by
Nehrig Stephen Earl and Nehrig Francine Marie
Home Financials for this Owner
Home Financials are based on the most recent Mortgage that was taken out on this home.
Original Mortgage
$23,000
Interest Rate
6.25%
Mortgage Type
New Conventional
Purchase Details
Closed on
Mar 22, 2006
Sold by
Nehrig Stephen Earl and Nehrig Francine Marie
Bought by
Nehrig Stephen E and Nehrig Francine M
Home Financials for this Owner
Home Financials are based on the most recent Mortgage that was taken out on this home.
Original Mortgage
$23,000
Interest Rate
6.25%
Mortgage Type
New Conventional
Purchase Details
Closed on
Jun 30, 2005
Sold by
Nehrig Stephen Earl and Nehrig Farncine Marie
Bought by
Nehrig Stephen Earl and Nehrig Francine Marie
Create a Home Valuation Report for This Property
The Home Valuation Report is an in-depth analysis detailing your home's value as well as a comparison with similar homes in the area
Home Values in the Area
Average Home Value in this Area
Purchase History
| Date | Buyer | Sale Price | Title Company |
|---|---|---|---|
| Nehrig Stephen Earl | -- | Accommodation | |
| Nehrig Stephen Earl | -- | Accommodation | |
| Nehrig Stephen E | -- | Old Republic Title Company | |
| Nehrig Stephen Earl | -- | -- |
Source: Public Records
Mortgage History
| Date | Status | Borrower | Loan Amount |
|---|---|---|---|
| Closed | Nehrig Stephen E | $23,000 |
Source: Public Records
Tax History Compared to Growth
Tax History
| Year | Tax Paid | Tax Assessment Tax Assessment Total Assessment is a certain percentage of the fair market value that is determined by local assessors to be the total taxable value of land and additions on the property. | Land | Improvement |
|---|---|---|---|---|
| 2025 | $1,941 | $150,479 | $29,527 | $120,952 |
| 2024 | $1,941 | $147,529 | $28,948 | $118,581 |
| 2023 | $1,893 | $144,637 | $28,381 | $116,256 |
| 2022 | $1,841 | $141,801 | $27,824 | $113,977 |
| 2021 | $1,807 | $139,021 | $27,278 | $111,743 |
| 2020 | $1,793 | $137,596 | $26,998 | $110,598 |
| 2019 | $1,774 | $134,899 | $26,469 | $108,430 |
| 2018 | $1,746 | $132,254 | $25,950 | $106,304 |
| 2017 | $1,721 | $129,661 | $25,441 | $104,220 |
| 2016 | $1,653 | $127,119 | $24,942 | $102,177 |
| 2015 | $1,634 | $125,210 | $24,567 | $100,643 |
| 2014 | $1,599 | $122,758 | $24,086 | $98,672 |
Source: Public Records
Map
Nearby Homes
- 8284 Kendall Dr
- 7988 Aldea Cir
- 21254 Lorca Cir Unit 51
- 8401 Atlanta Ave
- 8331 Snowbird Dr
- 21131 Greenboro Ln
- 21032 Shepherd Ln
- 21331 Balerma Ln
- 8633 Portola Ct
- 21752 Pacific Coast Hwy Unit 20
- 21752 Pacific Coast Hwy Unit 11-A
- 21851 Newland St Unit 7
- 21851 Newland St Unit 279
- 21851 Newland St Unit 58
- 21851 Newland St Unit 8
- 21851 Newland St Unit 45
- 21851 Newland St Unit 255
- 21851 Newland St Unit 232
- 21851 Newland St Unit 117
- 21851 Newland St Unit 44
- 21261 Cupar Ln
- 21241 Cupar Ln
- 8231 Ridgefield Dr
- 8225 Ridgefield Dr
- 21271 Cupar Ln
- 21231 Cupar Ln
- 8221 Ridgefield Dr
- 8222 Ridgefield Dr
- 8216 Ridgefield Dr
- 8215 Ridgefield Dr
- 21252 Cupar Ln
- 8232 Pawtucket Dr
- 21242 Cupar Ln
- 8212 Ridgefield Dr
- 21262 Cupar Ln
- 8211 Ridgefield Dr
- 21271 Freeport Ln
- 21291 Cupar Ln
- 21221 Cupar Ln
- 8226 Pawtucket Dr