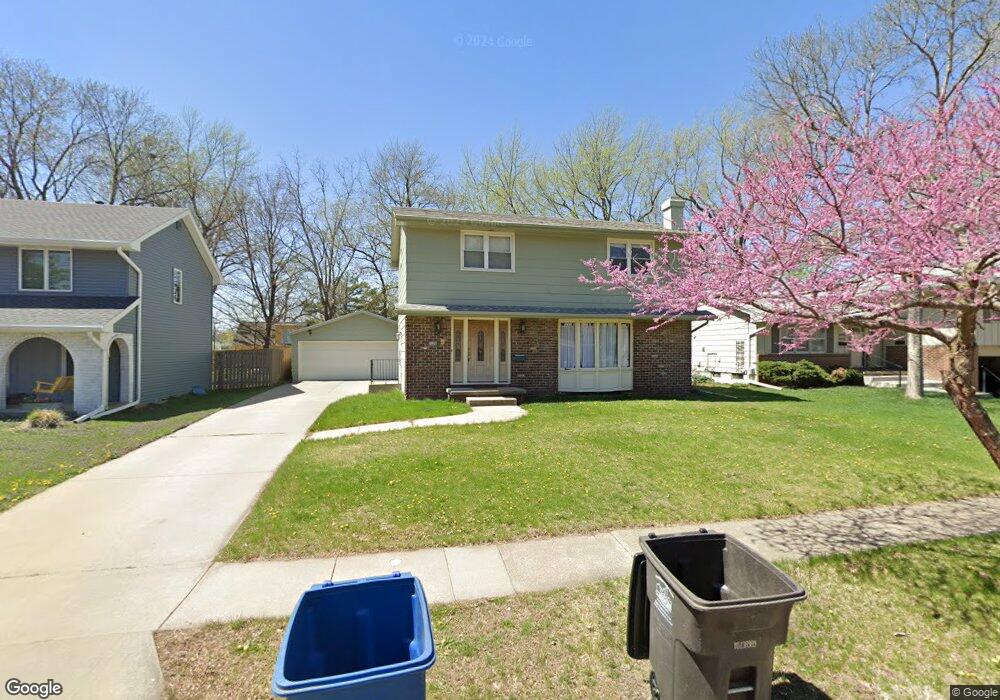
2126 47th St Des Moines, IA 50310
Beaverdale NeighborhoodEstimated Value: $299,000 - $339,455
4
Beds
2
Baths
1,568
Sq Ft
$200/Sq Ft
Est. Value
About This Home
This home is located at 2126 47th St, Des Moines, IA 50310 and is currently estimated at $313,864, approximately $200 per square foot. 2126 47th St is a home located in Polk County with nearby schools including Perkins Elementary School, Merrill Middle School, and Roosevelt High School.
Ownership History
Date
Name
Owned For
Owner Type
Purchase Details
Closed on
Mar 2, 2017
Sold by
Thiandoum El Hadji Malick
Bought by
Lechtenberg Kate Dower
Current Estimated Value
Purchase Details
Closed on
Feb 22, 2017
Sold by
Thiandoum El Hadji Malick
Bought by
Lechtenberg Kate Dower
Purchase Details
Closed on
Sep 21, 2009
Sold by
Dawson Craig L and Dawson Julie E
Bought by
Thiandoum El Hadji Malick and Lechtenberg Kate D
Home Financials for this Owner
Home Financials are based on the most recent Mortgage that was taken out on this home.
Original Mortgage
$154,156
Interest Rate
5.38%
Mortgage Type
FHA
Create a Home Valuation Report for This Property
The Home Valuation Report is an in-depth analysis detailing your home's value as well as a comparison with similar homes in the area
Home Values in the Area
Average Home Value in this Area
Purchase History
| Date | Buyer | Sale Price | Title Company |
|---|---|---|---|
| Lechtenberg Kate Dower | -- | None Available | |
| Lechtenberg Kate Dower | -- | None Available | |
| Thiandoum El Hadji Malick | $156,500 | Itc |
Source: Public Records
Mortgage History
| Date | Status | Borrower | Loan Amount |
|---|---|---|---|
| Previous Owner | Thiandoum El Hadji Malick | $154,156 |
Source: Public Records
Tax History Compared to Growth
Tax History
| Year | Tax Paid | Tax Assessment Tax Assessment Total Assessment is a certain percentage of the fair market value that is determined by local assessors to be the total taxable value of land and additions on the property. | Land | Improvement |
|---|---|---|---|---|
| 2025 | $5,864 | $337,900 | $57,900 | $280,000 |
| 2024 | $5,864 | $308,500 | $52,000 | $256,500 |
| 2023 | $6,048 | $308,500 | $52,000 | $256,500 |
| 2022 | $6,000 | $265,500 | $46,000 | $219,500 |
| 2021 | $5,844 | $265,500 | $46,000 | $219,500 |
| 2020 | $6,066 | $242,800 | $42,100 | $200,700 |
| 2019 | $5,718 | $242,800 | $42,100 | $200,700 |
| 2018 | $5,656 | $221,300 | $37,400 | $183,900 |
| 2017 | $5,070 | $221,300 | $37,400 | $183,900 |
| 2016 | $4,936 | $196,000 | $32,800 | $163,200 |
| 2015 | $4,936 | $196,000 | $32,800 | $163,200 |
| 2014 | $4,420 | $181,500 | $29,800 | $151,700 |
Source: Public Records
Map
Nearby Homes