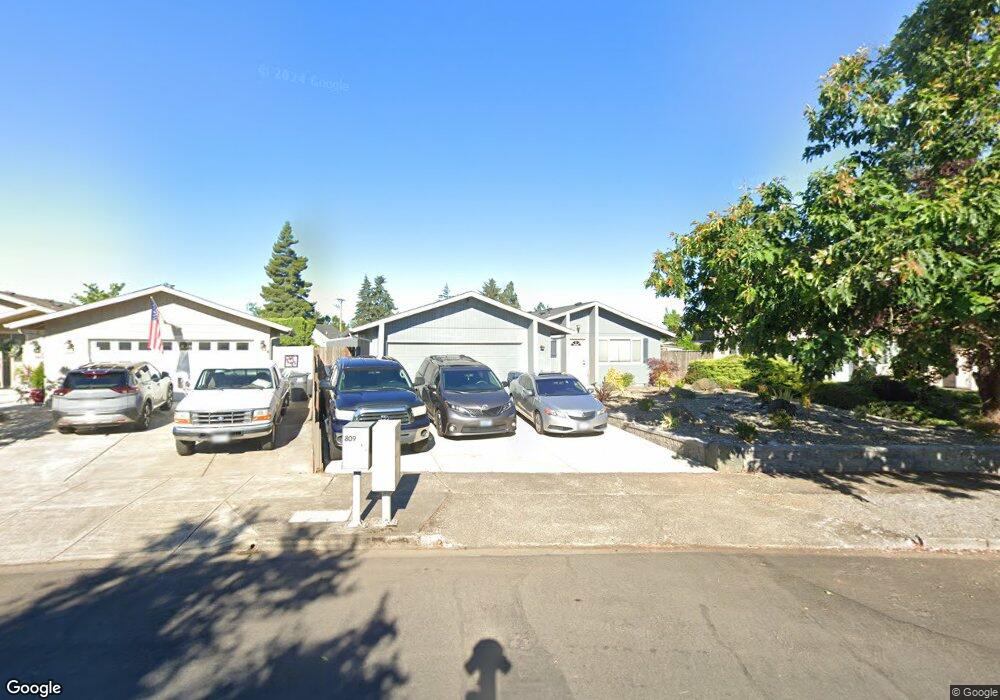
2126 6th St Springfield, OR 97477
North Springfield NeighborhoodEstimated Value: $370,000 - $401,000
3
Beds
2
Baths
1,036
Sq Ft
$367/Sq Ft
Est. Value
About This Home
This home is located at 2126 6th St, Springfield, OR 97477 and is currently estimated at $380,394, approximately $367 per square foot. 2126 6th St is a home located in Lane County with nearby schools including Elizabeth Page Elementary School, Briggs Middle School, and Springfield High School.
Ownership History
Date
Name
Owned For
Owner Type
Purchase Details
Closed on
Jun 8, 2004
Sold by
Sohler Heinrich G and Sohler Melanie S
Bought by
Pansoy Joeann
Current Estimated Value
Home Financials for this Owner
Home Financials are based on the most recent Mortgage that was taken out on this home.
Original Mortgage
$90,000
Outstanding Balance
$42,678
Interest Rate
5.99%
Mortgage Type
Purchase Money Mortgage
Estimated Equity
$337,716
Purchase Details
Closed on
Nov 20, 1997
Sold by
Asvos George and Asvos Maria
Bought by
Sohler Heinrich G and Sohler Melanie S
Home Financials for this Owner
Home Financials are based on the most recent Mortgage that was taken out on this home.
Original Mortgage
$109,180
Interest Rate
7.33%
Mortgage Type
FHA
Create a Home Valuation Report for This Property
The Home Valuation Report is an in-depth analysis detailing your home's value as well as a comparison with similar homes in the area
Home Values in the Area
Average Home Value in this Area
Purchase History
| Date | Buyer | Sale Price | Title Company |
|---|---|---|---|
| Pansoy Joeann | $112,500 | American Title Group | |
| Sohler Heinrich G | $110,000 | Oregon Title Insurance Co |
Source: Public Records
Mortgage History
| Date | Status | Borrower | Loan Amount |
|---|---|---|---|
| Open | Pansoy Joeann | $90,000 | |
| Previous Owner | Sohler Heinrich G | $109,180 | |
| Closed | Pansoy Joeann | $22,500 |
Source: Public Records
Tax History
| Year | Tax Paid | Tax Assessment Tax Assessment Total Assessment is a certain percentage of the fair market value that is determined by local assessors to be the total taxable value of land and additions on the property. | Land | Improvement |
|---|---|---|---|---|
| 2025 | $3,541 | $193,125 | -- | -- |
| 2024 | $3,484 | $187,500 | -- | -- |
| 2023 | $3,484 | $182,039 | $0 | $0 |
| 2022 | $3,301 | $180,824 | $0 | $0 |
| 2021 | $3,242 | $175,558 | $0 | $0 |
| 2020 | $3,148 | $170,445 | $0 | $0 |
| 2019 | $3,053 | $165,481 | $0 | $0 |
| 2018 | $2,878 | $155,983 | $0 | $0 |
| 2017 | $2,767 | $155,983 | $0 | $0 |
| 2016 | $2,709 | $151,440 | $0 | $0 |
| 2015 | $2,632 | $147,029 | $0 | $0 |
| 2014 | $2,592 | $142,747 | $0 | $0 |
Source: Public Records
Map
Nearby Homes
Your Personal Tour Guide
Ask me questions while you tour the home.