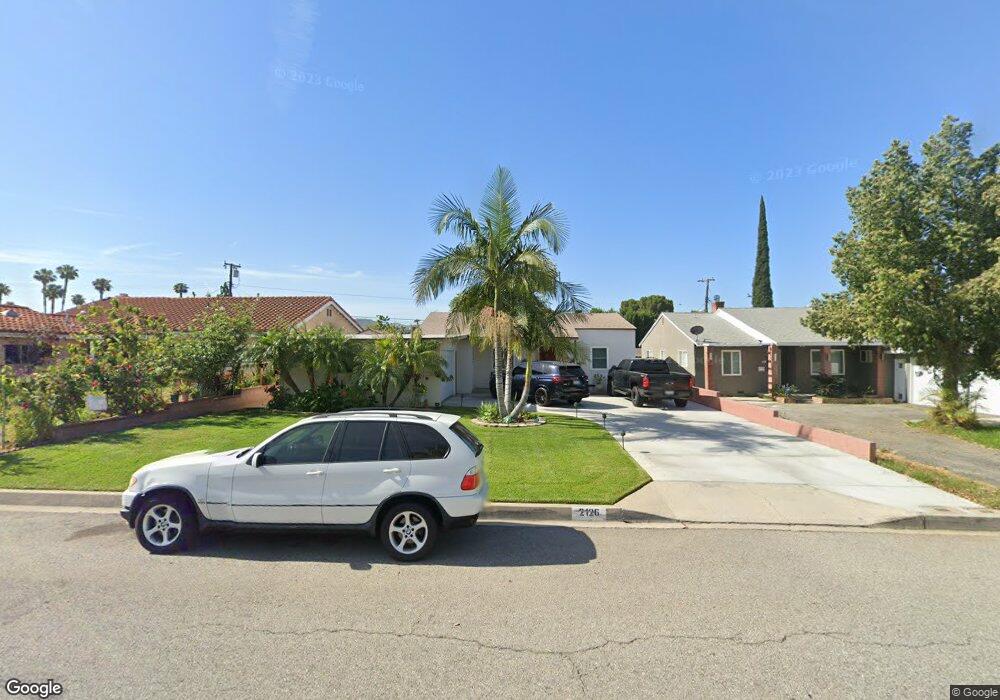
2126 E Idahome St West Covina, CA 91791
Estimated Value: $744,000 - $954,000
3
Beds
2
Baths
1,288
Sq Ft
$647/Sq Ft
Est. Value
About This Home
This home is located at 2126 E Idahome St, West Covina, CA 91791 and is currently estimated at $833,252, approximately $646 per square foot. 2126 E Idahome St is a home located in Los Angeles County with nearby schools including Workman Elementary School, Traweek Middle School, and Covina High School.
Ownership History
Date
Name
Owned For
Owner Type
Purchase Details
Closed on
Nov 13, 2017
Sold by
Cornejo Edwin V
Bought by
Cornejo Edwin V and Cornejo Erlinda P
Current Estimated Value
Home Financials for this Owner
Home Financials are based on the most recent Mortgage that was taken out on this home.
Original Mortgage
$460,978
Outstanding Balance
$392,717
Interest Rate
4.5%
Mortgage Type
FHA
Estimated Equity
$440,535
Purchase Details
Closed on
Jan 4, 2006
Sold by
Jones Saundra L
Bought by
Cornejo Edwing and Hernandez Erlinda P
Home Financials for this Owner
Home Financials are based on the most recent Mortgage that was taken out on this home.
Original Mortgage
$404,000
Interest Rate
6.5%
Mortgage Type
Purchase Money Mortgage
Purchase Details
Closed on
May 25, 2001
Sold by
Jones Saundra L
Bought by
Jones Saundra L and 2001 Jones Family Trust
Purchase Details
Closed on
Jan 29, 1996
Sold by
Murphy Ida May
Bought by
Jones Saundra M
Create a Home Valuation Report for This Property
The Home Valuation Report is an in-depth analysis detailing your home's value as well as a comparison with similar homes in the area
Home Values in the Area
Average Home Value in this Area
Purchase History
| Date | Buyer | Sale Price | Title Company |
|---|---|---|---|
| Cornejo Edwin V | -- | Servicelink | |
| Cornejo Edwing | $505,000 | Landwood Title Company | |
| Jones Saundra L | -- | -- | |
| Jones Saundra M | $94,836 | -- |
Source: Public Records
Mortgage History
| Date | Status | Borrower | Loan Amount |
|---|---|---|---|
| Open | Cornejo Edwin V | $460,978 | |
| Closed | Cornejo Edwing | $404,000 |
Source: Public Records
Tax History Compared to Growth
Tax History
| Year | Tax Paid | Tax Assessment Tax Assessment Total Assessment is a certain percentage of the fair market value that is determined by local assessors to be the total taxable value of land and additions on the property. | Land | Improvement |
|---|---|---|---|---|
| 2025 | $8,396 | $696,282 | $546,351 | $149,931 |
| 2024 | $8,396 | $682,631 | $535,639 | $146,992 |
| 2023 | $8,270 | $669,247 | $525,137 | $144,110 |
| 2022 | $8,158 | $656,126 | $514,841 | $141,285 |
| 2021 | $7,892 | $630,800 | $493,600 | $137,200 |
| 2019 | $6,545 | $515,000 | $403,000 | $112,000 |
| 2018 | $6,366 | $515,000 | $403,000 | $112,000 |
| 2017 | $5,993 | $483,000 | $382,000 | $101,000 |
| 2016 | $5,870 | $483,000 | $382,000 | $101,000 |
| 2015 | $5,122 | $424,000 | $335,000 | $89,000 |
| 2014 | $4,782 | $392,100 | $310,000 | $82,100 |
Source: Public Records
Map
Nearby Homes
- 110 S Baymar St
- 213 S Meadow Rd
- 2407 E Walnut Creek Pkwy
- 2147 E Rio Verde Dr
- 577 S Albertson Ave
- 2249 E Rio Verde Dr
- 1940 E Walnut Creek Pkwy
- 1715 E Mardina St
- 1714 E Idahome St
- 235 S Azusa Ave
- 131 S Myrtlewood St
- 1626 E Mardina St
- 511 W Puente St Unit 4
- 511 W Puente St Unit 1
- 543 W Puente St Unit 3
- 501 Embrook Way
- 708 N La Breda Ave
- 193 S Hollenbeck Ave
- 1536 E Norma Ave
- 123 S Hollenbeck Ave
- 2122 E Idahome St
- 2132 E Idahome St
- 2129 E Mardina St
- 2136 E Idahome St
- 2114 E Shamwood St
- 2135 E Mardina St
- 2112 E Shamwood St
- 2125 E Mardina St
- 2140 E Idahome St
- 2125 E Idahome St
- 2131 E Idahome St
- 2121 E Idahome St
- 2137 E Idahome St
- 2123 E Mardina St
- 2117 E Idahome St
- 2144 E Idahome St
- 2141 E Idahome St
- 2145 E Mardina St
- 2109 E Shamwood St
- 2111 E Idahome St