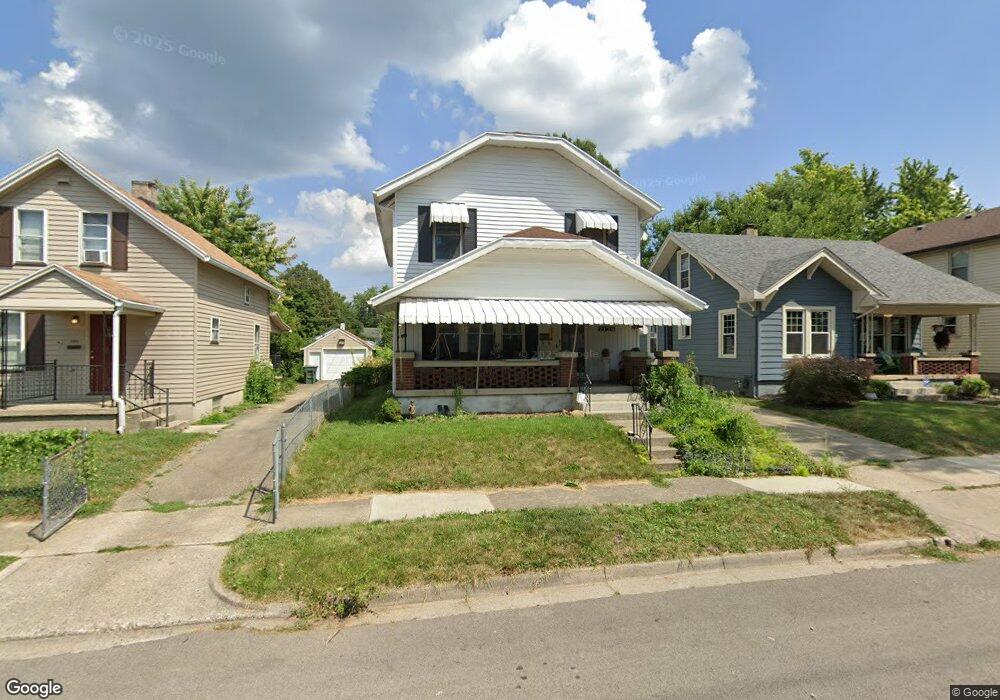
2126 Fauver Ave Dayton, OH 45420
Belmont NeighborhoodEstimated Value: $172,000 - $198,000
3
Beds
2
Baths
1,723
Sq Ft
$108/Sq Ft
Est. Value
About This Home
This home is located at 2126 Fauver Ave, Dayton, OH 45420 and is currently estimated at $185,539, approximately $107 per square foot. 2126 Fauver Ave is a home located in Montgomery County with nearby schools including Cleveland Elementary School, Eastmont Elementary, and Horace Mann Elementary School.
Ownership History
Date
Name
Owned For
Owner Type
Purchase Details
Closed on
Oct 26, 2021
Sold by
Moore Megan K and Moore Joshua
Bought by
Conley Samuel S
Current Estimated Value
Home Financials for this Owner
Home Financials are based on the most recent Mortgage that was taken out on this home.
Original Mortgage
$137,655
Outstanding Balance
$126,050
Interest Rate
3.09%
Mortgage Type
New Conventional
Estimated Equity
$59,489
Purchase Details
Closed on
Sep 14, 2017
Sold by
Pope David E and Pope Lerae
Bought by
Moore Megan K
Home Financials for this Owner
Home Financials are based on the most recent Mortgage that was taken out on this home.
Original Mortgage
$97,206
Interest Rate
3.75%
Mortgage Type
FHA
Purchase Details
Closed on
Aug 28, 2009
Sold by
Williams Marybeth
Bought by
Pope David E
Home Financials for this Owner
Home Financials are based on the most recent Mortgage that was taken out on this home.
Original Mortgage
$73,641
Interest Rate
5.21%
Mortgage Type
FHA
Create a Home Valuation Report for This Property
The Home Valuation Report is an in-depth analysis detailing your home's value as well as a comparison with similar homes in the area
Home Values in the Area
Average Home Value in this Area
Purchase History
| Date | Buyer | Sale Price | Title Company |
|---|---|---|---|
| Conley Samuel S | $144,900 | Fidelity Lawyers Ttl Agcy Ll | |
| Moore Megan K | $99,000 | Landmark Title Agency South | |
| Pope David E | $75,000 | Attorney |
Source: Public Records
Mortgage History
| Date | Status | Borrower | Loan Amount |
|---|---|---|---|
| Open | Conley Samuel S | $137,655 | |
| Previous Owner | Moore Megan K | $97,206 | |
| Previous Owner | Pope David E | $73,641 |
Source: Public Records
Tax History Compared to Growth
Tax History
| Year | Tax Paid | Tax Assessment Tax Assessment Total Assessment is a certain percentage of the fair market value that is determined by local assessors to be the total taxable value of land and additions on the property. | Land | Improvement |
|---|---|---|---|---|
| 2024 | $2,648 | $47,290 | $7,230 | $40,060 |
| 2023 | $2,648 | $47,290 | $7,230 | $40,060 |
| 2022 | $2,375 | $32,780 | $5,020 | $27,760 |
| 2021 | $2,362 | $32,780 | $5,020 | $27,760 |
| 2020 | $2,357 | $32,780 | $5,020 | $27,760 |
| 2019 | $2,262 | $28,380 | $5,570 | $22,810 |
| 2018 | $2,265 | $28,380 | $5,570 | $22,810 |
| 2017 | $2,247 | $28,380 | $5,570 | $22,810 |
| 2016 | $2,229 | $26,760 | $5,570 | $21,190 |
| 2015 | $2,108 | $26,760 | $5,570 | $21,190 |
| 2014 | $2,108 | $26,760 | $5,570 | $21,190 |
| 2012 | -- | $24,370 | $6,290 | $18,080 |
Source: Public Records
Map
Nearby Homes
- 2127 Moreland Ave
- 4022 Farnham Ave
- 3704 Wayne Ave
- 3618 Woodbine Ave
- 3605 Woodbine Ave
- 2135 Mershon Ave
- 1813 Rosemont Blvd
- 2039 Pershing Blvd
- 4111 Arcadia Blvd
- 1745 S Smithville Rd
- 525 Watervliet Ave
- 2520 Westfield Ave
- 4249 Pleasant View Ave
- 622 Watervliet Ave
- 4253 Pleasant View Ave
- 1742 Rosemont Blvd
- 4250 Pleasant View Ave
- 4040 Corinth Blvd
- 1730 Rosemont Blvd
- 2242 Nill Ave
- 2122 Fauver Ave
- 2130 Fauver Ave
- 2118 Fauver Ave
- 2134 Fauver Ave
- 2112 Fauver Ave
- 2138 Fauver Ave
- 2125 S Smithville Rd
- 2129 S Smithville Rd
- 2121 S Smithville Rd
- 2115 S Smithville Rd
- 2133 S Smithville Rd
- 2142 Fauver Ave
- 2137 S Smithville Rd
- 2127 Fauver Ave
- 2131 Fauver Ave
- 2104 Fauver Ave
- 3903 Woodbine Ave
- 2109 S Smithville Rd
- 2141 S Smithville Rd
- 3825 Woodbine Ave