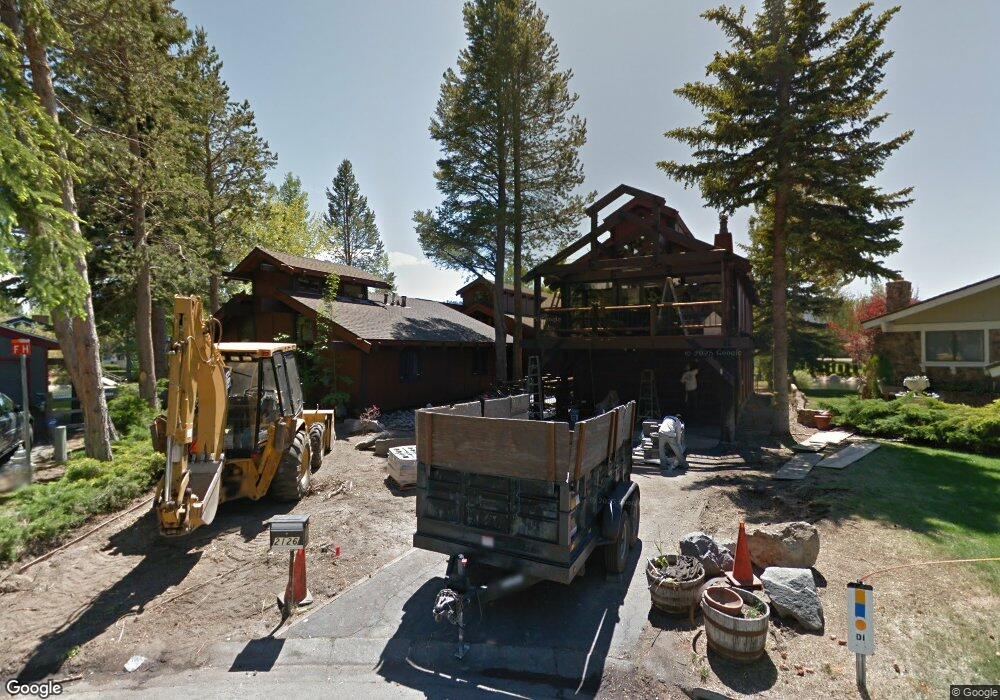
2126 Monterey Dr South Lake Tahoe, CA 96150
Estimated Value: $1,042,000 - $2,539,462
5
Beds
3
Baths
3,604
Sq Ft
$556/Sq Ft
Est. Value
About This Home
This home is located at 2126 Monterey Dr, South Lake Tahoe, CA 96150 and is currently estimated at $2,002,616, approximately $555 per square foot. 2126 Monterey Dr is a home located in El Dorado County with nearby schools including Tahoe Valley Elementary School, South Tahoe Middle School, and South Tahoe High School.
Ownership History
Date
Name
Owned For
Owner Type
Purchase Details
Closed on
Dec 2, 2016
Sold by
Fry Michael Francis
Bought by
Fry Michael Francis and Fry Deborah Fay
Current Estimated Value
Purchase Details
Closed on
Oct 3, 2016
Sold by
Fry Timothy James
Bought by
Fry Michael Francis
Purchase Details
Closed on
Oct 2, 2016
Sold by
Fry Enterprises Lp
Bought by
Fry Michael Francis and Fry Timothy James
Purchase Details
Closed on
May 13, 2014
Sold by
Fry Michael F and Fry Paul J
Bought by
Fry Enterprises Lp
Purchase Details
Closed on
Dec 6, 2013
Sold by
Fry Md Paul and Fry Family 2003 Trust
Bought by
Fry Michael F and Fry Paul J
Purchase Details
Closed on
Jan 27, 2010
Sold by
Fry Paul J
Bought by
Fry Michael F and Fry Paul J
Purchase Details
Closed on
Nov 27, 2009
Sold by
Fry Paul J
Bought by
Fry Michael F and Fry Paul J
Purchase Details
Closed on
Aug 26, 2009
Sold by
Fry Md Paul
Bought by
Fry Md Paul and Fry Family 2003 Trust
Purchase Details
Closed on
Nov 22, 1999
Sold by
Fry Dolores L
Bought by
Fry Dolores L and The Dolores L Fry Qualified Pe
Create a Home Valuation Report for This Property
The Home Valuation Report is an in-depth analysis detailing your home's value as well as a comparison with similar homes in the area
Home Values in the Area
Average Home Value in this Area
Purchase History
| Date | Buyer | Sale Price | Title Company |
|---|---|---|---|
| Fry Michael Francis | -- | None Available | |
| Fry Michael Francis | $400,000 | None Available | |
| Fry Michael Francis | $400,000 | None Available | |
| Fry Michael Francis | -- | None Available | |
| Fry Michael Francis | -- | None Available | |
| Fry Enterprises Lp | -- | None Available | |
| Fry Michael F | -- | Old Republic Title Company | |
| Fry Michael F | -- | None Available | |
| Fry Michael F | -- | None Available | |
| Fry Michael F | -- | None Available | |
| Fry Md Paul | -- | None Available | |
| Fry Md Paul | -- | None Available | |
| Fry Dolores L | -- | -- | |
| Fry Paul J | -- | -- | |
| Fry Paul J | -- | -- |
Source: Public Records
Tax History Compared to Growth
Tax History
| Year | Tax Paid | Tax Assessment Tax Assessment Total Assessment is a certain percentage of the fair market value that is determined by local assessors to be the total taxable value of land and additions on the property. | Land | Improvement |
|---|---|---|---|---|
| 2025 | $10,941 | $1,045,210 | $371,869 | $673,341 |
| 2024 | $10,941 | $1,024,717 | $364,578 | $660,139 |
| 2023 | $10,750 | $1,004,626 | $357,430 | $647,196 |
| 2022 | $10,644 | $984,928 | $350,422 | $634,506 |
| 2021 | $10,478 | $965,616 | $343,551 | $622,065 |
| 2020 | $10,326 | $955,716 | $340,029 | $615,687 |
| 2019 | $10,275 | $936,977 | $333,362 | $603,615 |
| 2018 | $10,045 | $918,606 | $326,826 | $591,780 |
| 2017 | $9,886 | $900,595 | $320,418 | $580,177 |
| 2016 | $3,309 | $295,906 | $60,069 | $235,837 |
| 2015 | $3,141 | $291,464 | $59,168 | $232,296 |
| 2014 | $3,141 | $285,757 | $58,010 | $227,747 |
Source: Public Records
Map
Nearby Homes
- 569 Lucerne Way
- 2185 Morro Dr
- 2081 Venice Dr Unit 285
- 2081 Venice Dr Unit 280
- 2071 Venice Dr Unit 294
- 552 Christie Dr Unit 307
- 555 Tahoe Keys Blvd Unit 13
- 2031 Venice Dr Unit 322
- 2191 Butler Ave
- 497 Tahoe Keys Blvd Unit 20
- 489 Tahoe Keys Blvd Unit 68
- 489 Tahoe Keys Blvd Unit 47
- 489 Tahoe Keys Blvd Unit 55
- 489 Tahoe Keys Blvd Unit 56
- 2030 Aloha Dr
- 741 Tahoe Island Dr
- 2175 Royal Ave
- 724 Tahoe Island Dr
- 1938 Marconi Way
- 2244 Texas Ave
- 2130 Monterey Dr
- 2127 Monterey Dr
- 2131 Monterey Dr
- 2136 Monterey Dr
- 559 Lucerne Way
- 551 Lucerne Way
- 565 Lucerne Way
- 2135 Monterey Dr
- 2159 Morro Dr
- 2142 Monterey Dr
- 2141 Monterey Dr
- 2165 Morro Dr
- 2157 Morro Dr
- 2146 Monterey Dr
- 2171 Morro Dr
- 575 Lucerne Way
- 549 Lucerne Way
- 2145 Monterey Dr
- 2175 Morro Dr
- 2130 Inverness Dr