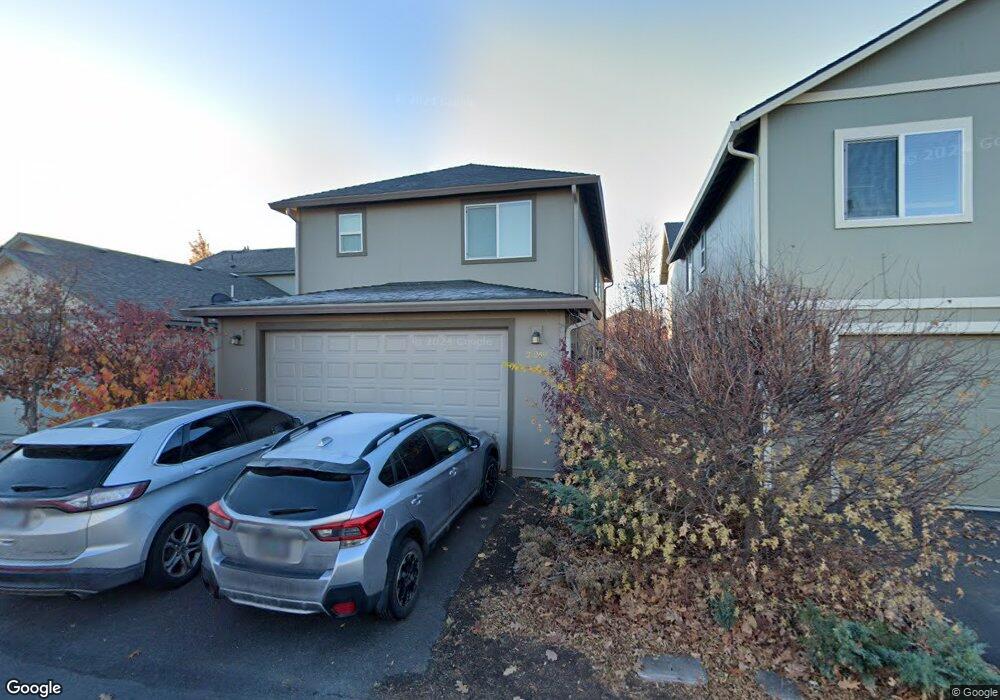
21269 Bellflower Place Bend, OR 97702
Larkspur NeighborhoodEstimated Value: $554,748 - $663,000
3
Beds
3
Baths
1,806
Sq Ft
$342/Sq Ft
Est. Value
About This Home
This home is located at 21269 Bellflower Place, Bend, OR 97702 and is currently estimated at $618,437, approximately $342 per square foot. 21269 Bellflower Place is a home located in Deschutes County with nearby schools including Buckingham Elementary School, Bend Senior High School, and Eastmont Community School.
Ownership History
Date
Name
Owned For
Owner Type
Purchase Details
Closed on
Nov 23, 2012
Sold by
Leong Kirby
Bought by
Leong Kirby C W and Leong Lynn Y
Current Estimated Value
Purchase Details
Closed on
May 22, 2008
Sold by
Vernon C Palmer Inc
Bought by
Leong Kirby C W and Leong Lynn Y
Home Financials for this Owner
Home Financials are based on the most recent Mortgage that was taken out on this home.
Original Mortgage
$208,000
Outstanding Balance
$131,071
Interest Rate
5.87%
Mortgage Type
Unknown
Estimated Equity
$487,366
Purchase Details
Closed on
May 21, 2008
Sold by
Leong Kirby C W and Leong Lynn Y
Bought by
Leong Kirby and Leong Lynn
Home Financials for this Owner
Home Financials are based on the most recent Mortgage that was taken out on this home.
Original Mortgage
$208,000
Outstanding Balance
$131,071
Interest Rate
5.87%
Mortgage Type
Unknown
Estimated Equity
$487,366
Purchase Details
Closed on
Feb 21, 2007
Sold by
Antonsen Chet and Skaar Thomas C
Bought by
Vernon C Palmer Inc
Create a Home Valuation Report for This Property
The Home Valuation Report is an in-depth analysis detailing your home's value as well as a comparison with similar homes in the area
Home Values in the Area
Average Home Value in this Area
Purchase History
| Date | Buyer | Sale Price | Title Company |
|---|---|---|---|
| Leong Kirby C W | -- | None Available | |
| Leong Kirby C W | $260,000 | Western Title & Escrow Co | |
| Leong Kirby | -- | Accommodation | |
| Vernon C Palmer Inc | $71,487 | Western Title & Escrow Co |
Source: Public Records
Mortgage History
| Date | Status | Borrower | Loan Amount |
|---|---|---|---|
| Open | Leong Kirby C W | $208,000 |
Source: Public Records
Tax History Compared to Growth
Tax History
| Year | Tax Paid | Tax Assessment Tax Assessment Total Assessment is a certain percentage of the fair market value that is determined by local assessors to be the total taxable value of land and additions on the property. | Land | Improvement |
|---|---|---|---|---|
| 2025 | $3,582 | $211,990 | -- | -- |
| 2024 | $3,446 | $205,820 | -- | -- |
| 2023 | $3,195 | $199,830 | $0 | $0 |
| 2022 | $2,981 | $188,360 | $0 | $0 |
| 2021 | $2,985 | $182,880 | $0 | $0 |
| 2020 | $2,832 | $182,880 | $0 | $0 |
| 2019 | $2,753 | $177,560 | $0 | $0 |
| 2018 | $2,675 | $172,390 | $0 | $0 |
| 2017 | $2,597 | $167,370 | $0 | $0 |
| 2016 | $2,477 | $162,500 | $0 | $0 |
| 2015 | $2,408 | $157,770 | $0 | $0 |
| 2014 | $2,337 | $153,180 | $0 | $0 |
Source: Public Records
Map
Nearby Homes
- 61704 Marigold Ln
- 61698 Rigel Way
- 21283 Dove Ln
- 61648 Gemini Way
- 21177 Ritz Place
- 21176 Desert Skies Place
- 21154 Ritz Place
- 61839 SE 27th St
- 61847 SE 27th St
- 61683 Daly Estates Dr
- 61730 Joan Ct
- 61839 Avonlea Cir
- 61635 Daly Estates Dr Unit 17
- 61620 Daly Estates Dr
- 61807 SE Rolo Ct
- 21130 SE Reed Market Rd
- 21116 SE Reed Market Rd
- 61635 Pettigrew Rd Unit 12
- 61662 Thunder Rd
- 61969 SE 27th St
- 21265 Bellflower Place
- 21273 Bellflower Place
- 21261 Bellflower Place
- 21277 Bellflower Place
- 21289 Bellflower Place
- 0 Bellflower Place
- 21281 Bellflower Place
- 21257 Bellflower Place
- 21267 Daylily Ave
- 21261 SE Daylily Ave
- 21273 Daylily Ave
- 21285 Bellflower Place
- 21255 SE Daylily Ave
- 21279 Daylily Ave
- 0 Camellia St
- 21270 Woodruff Place
- 21266 Woodruff Place
- 21262 Woodruff Place
- 21274 Woodruff Place
- 21293 Bellflower Place