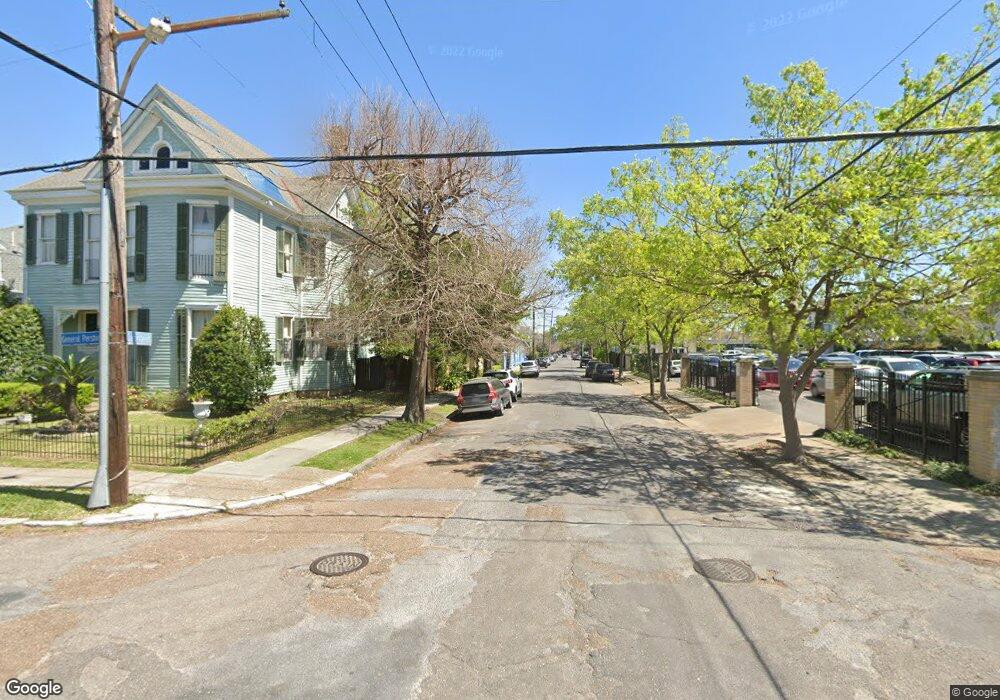
2127 29 Gen Pershing New Orleans, LA 70115
Milan NeighborhoodEstimated Value: $582,000 - $709,593
4
Beds
2
Baths
2,500
Sq Ft
$264/Sq Ft
Est. Value
About This Home
This home is located at 2127 29 Gen Pershing, New Orleans, LA 70115 and is currently estimated at $658,898, approximately $263 per square foot. 2127 29 Gen Pershing is a home located in Orleans Parish with nearby schools including Lawrence D. Crocker College Prep, Samuel J. Green Charter School, and Sophie B. Wright Institute of Academic Excellence.
Ownership History
Date
Name
Owned For
Owner Type
Purchase Details
Closed on
May 4, 2021
Sold by
Hara Jeffrey H O
Bought by
Gay Eli James and Childers-Gray Terry Elizabeth
Current Estimated Value
Home Financials for this Owner
Home Financials are based on the most recent Mortgage that was taken out on this home.
Original Mortgage
$500,000
Outstanding Balance
$453,125
Interest Rate
3.1%
Mortgage Type
New Conventional
Estimated Equity
$205,773
Create a Home Valuation Report for This Property
The Home Valuation Report is an in-depth analysis detailing your home's value as well as a comparison with similar homes in the area
Home Values in the Area
Average Home Value in this Area
Purchase History
| Date | Buyer | Sale Price | Title Company |
|---|---|---|---|
| Gay Eli James | $625,000 | Monarch Title Llc |
Source: Public Records
Mortgage History
| Date | Status | Borrower | Loan Amount |
|---|---|---|---|
| Open | Gay Eli James | $500,000 |
Source: Public Records
Tax History Compared to Growth
Tax History
| Year | Tax Paid | Tax Assessment Tax Assessment Total Assessment is a certain percentage of the fair market value that is determined by local assessors to be the total taxable value of land and additions on the property. | Land | Improvement |
|---|---|---|---|---|
| 2025 | $7,352 | $59,520 | $9,600 | $49,920 |
| 2024 | $7,456 | $59,520 | $9,600 | $49,920 |
| 2023 | $6,505 | $55,630 | $3,840 | $51,790 |
| 2022 | $6,505 | $53,040 | $3,840 | $49,200 |
| 2021 | $5,092 | $42,200 | $3,840 | $38,360 |
| 2020 | $3,178 | $28,690 | $3,840 | $24,850 |
| 2019 | $3,299 | $28,690 | $3,840 | $24,850 |
| 2018 | $3,362 | $28,690 | $3,840 | $24,850 |
| 2017 | $3,196 | $28,690 | $3,840 | $24,850 |
| 2016 | $2,197 | $21,460 | $3,840 | $17,620 |
| 2015 | $2,154 | $21,460 | $3,840 | $17,620 |
| 2014 | -- | $21,460 | $3,840 | $17,620 |
| 2013 | -- | $21,460 | $3,840 | $17,620 |
Source: Public Records
Map
Nearby Homes
- 2127 General Pershing St
- 2123 General Pershing St
- 2125 General Pershing St
- 2131 General Pershing St
- 2119 General Pershing St
- 2121 General Pershing St
- 2135 General Pershing St
- 2139 General Pershing St
- 4220 Loyola Ave
- 2135 39 General Pershing St
- 2111 General Pershing St
- 2111 13 Gen Pershing St
- 4216 Loyola Ave
- 4221 S Saratoga St
- 4214C Loyola Ave
- 4214 Loyola Ave
- 4214 Loyola Ave Unit A
- 4214 Loyola Ave Unit C
- 2201 General Pershing St
- 4219 S Saratoga St