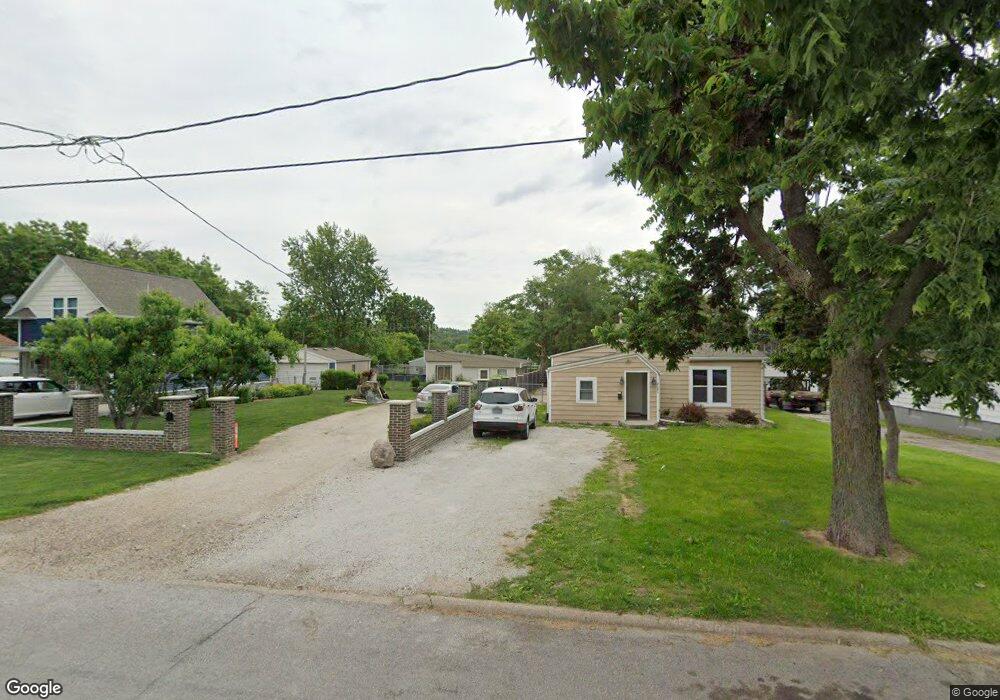
2127 E 23rd St Des Moines, IA 50317
Fairmont Park NeighborhoodEstimated Value: $82,000 - $189,000
1
Bed
1
Bath
587
Sq Ft
$213/Sq Ft
Est. Value
About This Home
This home is located at 2127 E 23rd St, Des Moines, IA 50317 and is currently estimated at $125,050, approximately $213 per square foot. 2127 E 23rd St is a home located in Polk County with nearby schools including Phillips Elementary, Goodrell Middle School, and North High School.
Ownership History
Date
Name
Owned For
Owner Type
Purchase Details
Closed on
Mar 4, 2025
Sold by
Chavez-Mascote Medardo and Cervantes-Reyes America Alejandrina
Bought by
Chavez-Mascote Medardo and Cervantes-Reyes America Alejandrina
Current Estimated Value
Purchase Details
Closed on
Apr 30, 2018
Sold by
Haberling John
Bought by
Chavez Mascote Medardo
Purchase Details
Closed on
Feb 17, 2004
Sold by
Haberling Geraldine A
Bought by
Haberling Geraldine A and Haberling John W
Create a Home Valuation Report for This Property
The Home Valuation Report is an in-depth analysis detailing your home's value as well as a comparison with similar homes in the area
Home Values in the Area
Average Home Value in this Area
Purchase History
| Date | Buyer | Sale Price | Title Company |
|---|---|---|---|
| Chavez-Mascote Medardo | -- | None Listed On Document | |
| Chavez-Mascote Medardo | -- | None Listed On Document | |
| Chavez Mascote Medardo | $25,000 | None Available | |
| Haberling Geraldine A | -- | -- |
Source: Public Records
Tax History
| Year | Tax Paid | Tax Assessment Tax Assessment Total Assessment is a certain percentage of the fair market value that is determined by local assessors to be the total taxable value of land and additions on the property. | Land | Improvement |
|---|---|---|---|---|
| 2025 | $1,252 | $72,700 | $26,200 | $46,500 |
| 2024 | $1,252 | $63,600 | $22,700 | $40,900 |
| 2023 | $1,198 | $63,600 | $22,700 | $40,900 |
| 2022 | $1,188 | $50,800 | $17,900 | $32,900 |
| 2021 | $1,132 | $50,800 | $17,900 | $32,900 |
| 2020 | $1,178 | $45,400 | $15,900 | $29,500 |
| 2019 | $718 | $45,400 | $15,900 | $29,500 |
| 2018 | $704 | $38,500 | $13,200 | $25,300 |
| 2017 | $690 | $38,500 | $13,200 | $25,300 |
| 2016 | $666 | $37,300 | $12,600 | $24,700 |
| 2015 | $666 | $37,300 | $12,600 | $24,700 |
| 2014 | $1,103 | $38,000 | $12,600 | $25,400 |
Source: Public Records
Map
Nearby Homes
- 2324 E 23rd St
- 1901 E 23rd St
- 2208 Tichenor St
- 2503 E 24th St
- 1821 E 25th St
- 2113 E 21st St
- 2539 E 23rd St
- 1614 Searle St
- 2654 Wisconsin Ave
- 1517 Delaware Ave
- 2114 Boyd St
- 2670 Wisconsin Ave
- 1410 E 23rd St
- 2612 Grandview Ave
- 2710 E Washington Ave
- 2633 Grandview Ave
- 1529 E 19th St
- 2555 Hull Ave
- 2757 Easton Blvd
- 1924 E 29th St
Your Personal Tour Guide
Ask me questions while you tour the home.