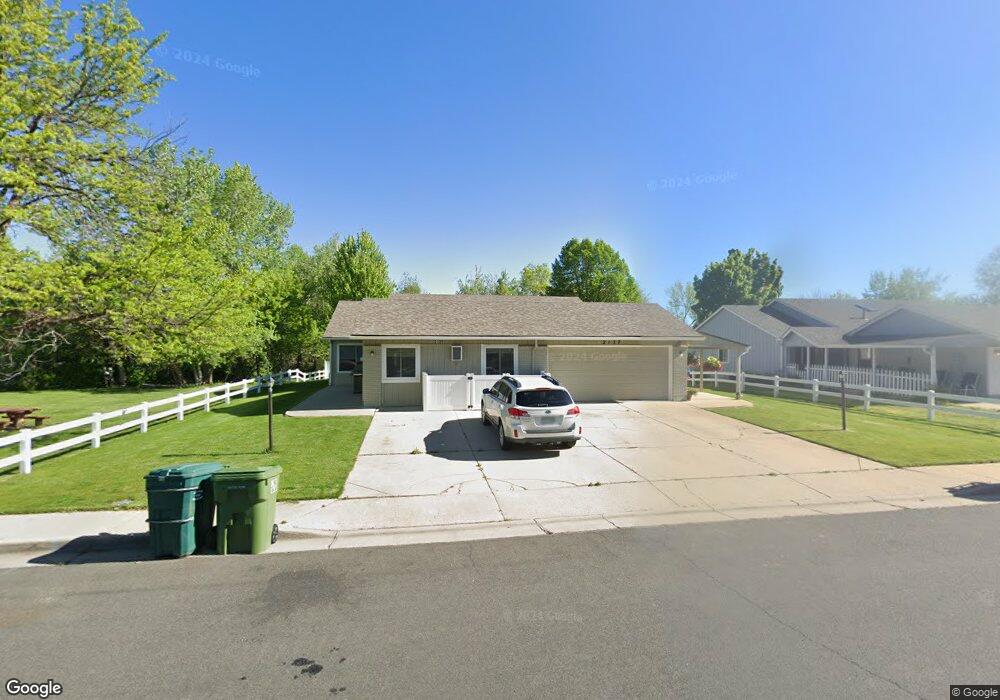
2127 Eagle Dr Loveland, CO 80537
Estimated Value: $530,916 - $600,000
7
Beds
3
Baths
2,516
Sq Ft
$223/Sq Ft
Est. Value
About This Home
This home is located at 2127 Eagle Dr, Loveland, CO 80537 and is currently estimated at $560,979, approximately $222 per square foot. 2127 Eagle Dr is a home located in Larimer County with nearby schools including Sarah Milner Elementary School, Walt Clark Middle School, and Thompson Valley High School.
Ownership History
Date
Name
Owned For
Owner Type
Purchase Details
Closed on
Aug 29, 2003
Sold by
Ponto Robert and Ponto Dianne
Bought by
Neergaard Robin
Current Estimated Value
Home Financials for this Owner
Home Financials are based on the most recent Mortgage that was taken out on this home.
Original Mortgage
$183,750
Outstanding Balance
$83,067
Interest Rate
5.87%
Mortgage Type
Purchase Money Mortgage
Estimated Equity
$477,912
Purchase Details
Closed on
Jul 27, 1999
Sold by
Stout Dorothy L
Bought by
Ponto Robert and Ponto Dianne
Home Financials for this Owner
Home Financials are based on the most recent Mortgage that was taken out on this home.
Original Mortgage
$175,000
Interest Rate
7.63%
Purchase Details
Closed on
Jul 1, 1996
Sold by
Weston Thomas P
Bought by
Stout Dorothy L
Home Financials for this Owner
Home Financials are based on the most recent Mortgage that was taken out on this home.
Original Mortgage
$79,800
Interest Rate
8.15%
Create a Home Valuation Report for This Property
The Home Valuation Report is an in-depth analysis detailing your home's value as well as a comparison with similar homes in the area
Home Values in the Area
Average Home Value in this Area
Purchase History
| Date | Buyer | Sale Price | Title Company |
|---|---|---|---|
| Neergaard Robin | $245,000 | -- | |
| Ponto Robert | $175,000 | Security Title | |
| Stout Dorothy L | $78,200 | -- |
Source: Public Records
Mortgage History
| Date | Status | Borrower | Loan Amount |
|---|---|---|---|
| Open | Neergaard Robin | $183,750 | |
| Previous Owner | Ponto Robert | $175,000 | |
| Previous Owner | Stout Dorothy L | $79,800 | |
| Closed | Stout Dorothy L | $78,200 |
Source: Public Records
Tax History Compared to Growth
Tax History
| Year | Tax Paid | Tax Assessment Tax Assessment Total Assessment is a certain percentage of the fair market value that is determined by local assessors to be the total taxable value of land and additions on the property. | Land | Improvement |
|---|---|---|---|---|
| 2025 | $2,671 | $37,152 | $2,479 | $34,673 |
| 2024 | $2,576 | $37,152 | $2,479 | $34,673 |
| 2022 | $2,219 | $27,884 | $2,572 | $25,312 |
| 2021 | $2,280 | $28,686 | $2,646 | $26,040 |
| 2020 | $2,755 | $34,649 | $2,646 | $32,003 |
| 2019 | $2,708 | $34,649 | $2,646 | $32,003 |
| 2018 | $2,216 | $26,928 | $2,664 | $24,264 |
| 2017 | $1,908 | $26,928 | $2,664 | $24,264 |
| 2016 | $1,610 | $21,953 | $2,945 | $19,008 |
| 2015 | $1,597 | $21,960 | $2,950 | $19,010 |
| 2014 | $1,452 | $19,310 | $2,390 | $16,920 |
Source: Public Records
Map
Nearby Homes
- 332 Terri Dr
- 1786 Wintergreen Place
- 2120 3rd St SW Unit 1
- 628 Jocelyn Dr
- 432 Glenda Dr
- 677 Gayla Ct
- 706 S Gilpin Ave
- 229 Blossom Dr
- 858 S Ouray Dr
- 938 S Del Norte Ave
- 796 S Tyler Ave
- 827 S Buckeye Dr
- 874 S Buckeye Dr
- 2742 Daffodil Place
- 2821 5th St SW
- 850 Gardenia Dr
- 1725 Keyes Ct
- 825 Kaitlyn Cir
- 2503 10th St SW
- 543 Dana Ct
- 433 Terri Dr
- 2103 Eagle Dr
- 2204 Eagle Dr
- 2216 Eagle Dr
- 423 Terri Dr
- 2228 Eagle Dr
- 514 Jocelyn Dr
- 2205 Iris Place
- 409 Terri Dr
- 1853 Kinnikinnik Place
- 2309 5th Ct SW
- 2217 Iris Place
- 2240 Eagle Dr
- 1853 Eagle Dr
- 526 Jocelyn Dr
- 369 Terri Dr
- 1841 Kinnikinnik Place
- 1840 Kinnikinnik Place
- 1852 Wintergreen Place
- 380 Terri Dr