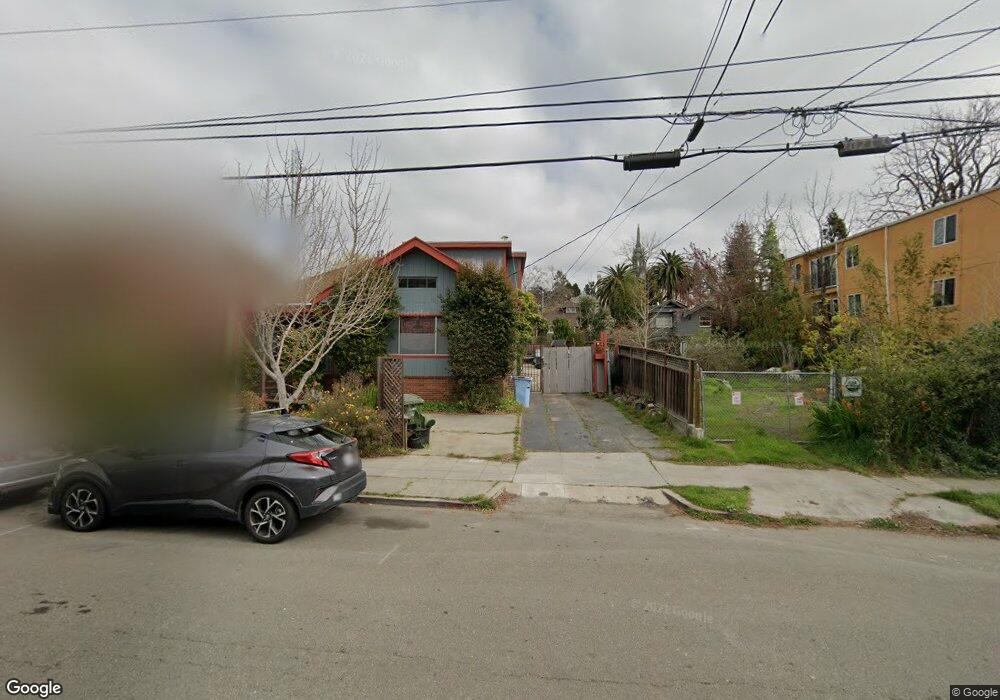
2127 Grant St Berkeley, CA 94703
Downtown Berkeley NeighborhoodEstimated Value: $1,605,000 - $2,876,000
Studio
--
Bath
4,130
Sq Ft
$562/Sq Ft
Est. Value
About This Home
This home is located at 2127 Grant St, Berkeley, CA 94703 and is currently estimated at $2,321,986, approximately $562 per square foot. 2127 Grant St is a home located in Alameda County with nearby schools including Washington Elementary School, Berkeley Arts Magnet at Whittier School, and Oxford Elementary School.
Ownership History
Date
Name
Owned For
Owner Type
Purchase Details
Closed on
Nov 9, 2018
Sold by
Innes Daphne J and Innes Mark H
Bought by
Junkarts Llc
Current Estimated Value
Home Financials for this Owner
Home Financials are based on the most recent Mortgage that was taken out on this home.
Original Mortgage
$200,000
Outstanding Balance
$175,500
Interest Rate
4.7%
Mortgage Type
Seller Take Back
Estimated Equity
$2,146,486
Purchase Details
Closed on
Aug 1, 2007
Sold by
Innes Daphne J and The Daphne J Innes Trust
Bought by
Innes Daphne J and Innes Mark H
Purchase Details
Closed on
Aug 18, 2003
Sold by
Innes Daphne J
Bought by
Innes Daphne J and Innes Mark H
Purchase Details
Closed on
Nov 3, 1999
Sold by
Innes Daphne J
Bought by
Innes Daphne J
Purchase Details
Closed on
Feb 27, 1999
Sold by
Innes Daphne J
Bought by
Innes Daphne J and Innes Mark H
Purchase Details
Closed on
Nov 12, 1996
Sold by
Innes Daphne J
Bought by
Innes Daphne J and Innes Mark H
Purchase Details
Closed on
Mar 6, 1996
Sold by
Redland Dorsey
Bought by
Innes Daphne J
Create a Home Valuation Report for This Property
The Home Valuation Report is an in-depth analysis detailing your home's value as well as a comparison with similar homes in the area
Home Values in the Area
Average Home Value in this Area
Purchase History
| Date | Buyer | Sale Price | Title Company |
|---|---|---|---|
| Junkarts Llc | $1,280,000 | First American Title Company | |
| Innes Daphne J | -- | Placer Title Company | |
| Innes Daphne J | -- | Alliance Title Company | |
| Innes Daphne J | -- | -- | |
| Innes Daphne J | -- | -- | |
| Innes Daphne J | -- | -- | |
| Innes Daphne J | $90,000 | Placer Title Company |
Source: Public Records
Mortgage History
| Date | Status | Borrower | Loan Amount |
|---|---|---|---|
| Open | Junkarts Llc | $200,000 |
Source: Public Records
Tax History
| Year | Tax Paid | Tax Assessment Tax Assessment Total Assessment is a certain percentage of the fair market value that is determined by local assessors to be the total taxable value of land and additions on the property. | Land | Improvement |
|---|---|---|---|---|
| 2025 | $19,900 | $1,427,840 | $780,850 | $646,990 |
| 2024 | $19,900 | $1,399,846 | $765,541 | $634,305 |
| 2023 | $19,508 | $1,372,403 | $750,533 | $621,870 |
| 2022 | $19,206 | $1,345,497 | $735,819 | $609,678 |
| 2021 | $19,603 | $1,319,116 | $721,392 | $597,724 |
| 2020 | $18,807 | $1,305,600 | $714,000 | $591,600 |
| 2019 | $18,289 | $1,280,000 | $700,000 | $580,000 |
| 2018 | $6,529 | $319,460 | $177,757 | $141,703 |
| 2017 | $6,147 | $313,198 | $174,273 | $138,925 |
| 2016 | $6,118 | $307,057 | $170,856 | $136,201 |
| 2015 | $6,021 | $302,446 | $168,290 | $134,156 |
| 2014 | $5,939 | $296,524 | $164,995 | $131,529 |
Source: Public Records
Map
Nearby Homes
- 2218 -2222 Grant St
- 2118 California St
- 1813 Sacramento St
- 1645 Dwight Way
- 2015 Delaware St
- 2015 Delaware St Unit A
- 1436 Delaware St
- 2350 Sacramento St
- 1411 Hearst Ave Unit 2
- 1625 Martin Luther King jr Way
- 1901 Parker St Unit 3
- 1808 Cedar St
- 2018 Blake St
- 1609 Bonita Ave Unit 5
- 1610 Milvia St
- 1612 Parker St
- 1612 Carleton St
- 1564 Sacramento St
- 2701 Grant St
- 1682 Oxford St
- 2119 Grant St
- 2117 Grant St
- 2115 Grant St
- 2133 & 2139 Grant St
- 2118 Mckinley Ave
- 2128 Mckinley Ave
- 2126 Mckinley Ave
- 2111 Grant St
- 2114 Mckinley Ave
- 2145 Grant St
- 2118 Grant St
- 2120 Grant St
- 2107 Grant St
- 2126 Grant St
- 2140 Mckinley Ave
- 2112 Mckinley Ave Unit D
- 2112 Mckinley Ave Unit C
- 2112 Mckinley Ave Unit B
- 2112 Mckinley Ave Unit A
- 2130 Grant St
Your Personal Tour Guide
Ask me questions while you tour the home.