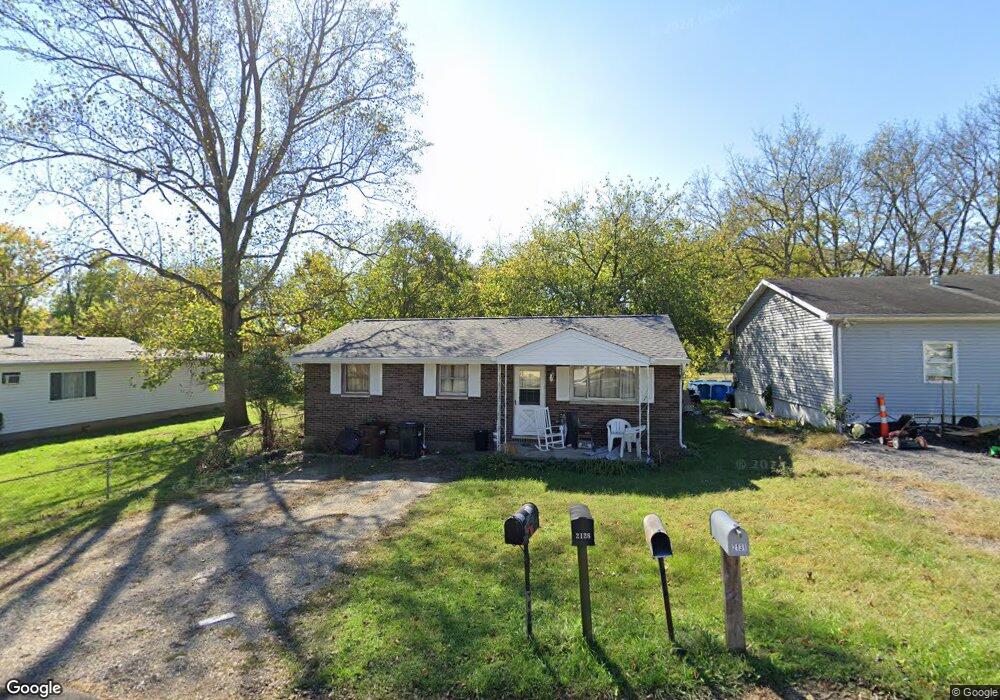
2127 Robin Ave Fairfield, OH 45014
Estimated Value: $138,531 - $169,000
3
Beds
1
Bath
912
Sq Ft
$174/Sq Ft
Est. Value
About This Home
This home is located at 2127 Robin Ave, Fairfield, OH 45014 and is currently estimated at $159,133, approximately $174 per square foot. 2127 Robin Ave is a home located in Butler County with nearby schools including Elda Elementary School, Ross Intermediate School, and Ross Middle School.
Ownership History
Date
Name
Owned For
Owner Type
Purchase Details
Closed on
Jun 25, 2009
Sold by
Secretary Of Housing & Urban Development
Bought by
Summe Carl and Summe Herb
Current Estimated Value
Purchase Details
Closed on
Feb 4, 2009
Sold by
Wells Fargo Bank Na
Bought by
Secretary Of Housing & Urban Development
Purchase Details
Closed on
Jan 21, 2009
Sold by
Wyatt Joseph R
Bought by
Wells Fargo Bank Na
Purchase Details
Closed on
Aug 18, 2005
Sold by
Lohr Ronald E
Bought by
Wyatt Joseph R
Home Financials for this Owner
Home Financials are based on the most recent Mortgage that was taken out on this home.
Original Mortgage
$97,231
Interest Rate
6.01%
Mortgage Type
FHA
Purchase Details
Closed on
Jan 18, 2005
Sold by
Lohr Melissa M
Bought by
Lohr Ronald E
Purchase Details
Closed on
Feb 7, 2002
Sold by
Moore Patricia L
Bought by
Lohr Ronald E and Lohr Melissa M
Purchase Details
Closed on
Jan 30, 2002
Sold by
Moore Sean W
Bought by
Lohr Ronald E and Lohr Melissa M
Purchase Details
Closed on
May 6, 1994
Create a Home Valuation Report for This Property
The Home Valuation Report is an in-depth analysis detailing your home's value as well as a comparison with similar homes in the area
Home Values in the Area
Average Home Value in this Area
Purchase History
| Date | Buyer | Sale Price | Title Company |
|---|---|---|---|
| Summe Carl | $34,250 | Lakeside Title & Escrow Agen | |
| Secretary Of Housing & Urban Development | -- | None Available | |
| Wells Fargo Bank Na | $27,000 | None Available | |
| Wyatt Joseph R | $98,000 | -- | |
| Lohr Ronald E | -- | -- | |
| Lohr Ronald E | $25,833 | -- | |
| Lohr Ronald E | $25,833 | -- | |
| -- | $43,900 | -- |
Source: Public Records
Mortgage History
| Date | Status | Borrower | Loan Amount |
|---|---|---|---|
| Previous Owner | Wyatt Joseph R | $97,231 |
Source: Public Records
Tax History
| Year | Tax Paid | Tax Assessment Tax Assessment Total Assessment is a certain percentage of the fair market value that is determined by local assessors to be the total taxable value of land and additions on the property. | Land | Improvement |
|---|---|---|---|---|
| 2025 | $1,540 | $29,730 | $2,610 | $27,120 |
| 2024 | $1,540 | $29,730 | $2,610 | $27,120 |
| 2023 | $1,394 | $29,730 | $2,610 | $27,120 |
| 2022 | $1,312 | $21,310 | $2,610 | $18,700 |
| 2021 | $1,103 | $21,310 | $2,610 | $18,700 |
| 2020 | $1,140 | $21,310 | $2,610 | $18,700 |
| 2019 | $1,314 | $17,510 | $2,580 | $14,930 |
| 2018 | $1,091 | $17,510 | $2,580 | $14,930 |
| 2017 | $746 | $17,510 | $2,580 | $14,930 |
| 2016 | $995 | $17,510 | $2,580 | $14,930 |
| 2015 | $771 | $17,510 | $2,580 | $14,930 |
| 2014 | $1,281 | $17,510 | $2,580 | $14,930 |
| 2013 | $1,281 | $18,580 | $3,010 | $15,570 |
Source: Public Records
Map
Nearby Homes
- 2781 Logan Ln Vc103
- 5560 Birch Dr
- 2379 Elda Dr
- 0 Miamitrail Ln Unit 1852362
- 4201 Dry Run Dr
- 2834 Wyatt Way
- 2800 Venice Crossing
- 2811 Wyatt Way
- 3978 Lukas Ln
- 2795 Venice Crossing Dr
- 4255 Miamitrail Ln
- 3985 Lukas Ln
- 3691 Silax Dr
- 3948 Lukas Ln
- 3938 Lukas Ln
- 3704 Silax Dr
- 3714 Silax Dr
- 3235 Covered Wagon Estates Ln
- 1 Stone Mill Rd
- 11961 Stonequarry Ct
- 2131 Robin Ave
- 2141 Robin Ave
- 2155 Robin Ave
- 2155 Robin Ave
- 2155 Robin Ave
- 2155 Robin Ave
- 2118 Thrush Ave
- 2118 Thrush Ave
- 2118 Thrush Ave
- 2118 Thrush Ave
- 2118 Thrush Ave
- 2128 Robin Ave
- 2134 Robin Ave
- 2148 Thrush Ave
- 2108 Thrush Ave
- 4214 Plover St
- 4214 Plover Ave
- 2144 Robin Ave
- 2154 Thrush Ave
- 2150 Robin Ave
Your Personal Tour Guide
Ask me questions while you tour the home.