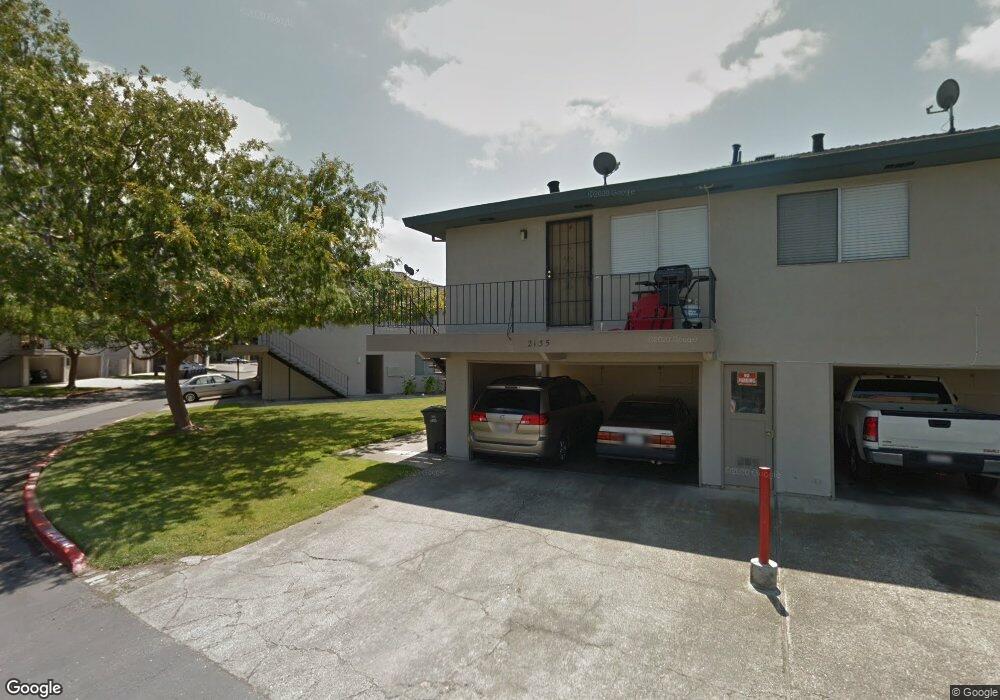
2127 Swan Ct Unit 1 Union City, CA 94587
Downtown Union City NeighborhoodEstimated Value: $461,000 - $511,000
2
Beds
1
Bath
810
Sq Ft
$598/Sq Ft
Est. Value
About This Home
This home is located at 2127 Swan Ct Unit 1, Union City, CA 94587 and is currently estimated at $484,310, approximately $597 per square foot. 2127 Swan Ct Unit 1 is a home located in Alameda County with nearby schools including Guy Jr. Emanuele Elementary School, Cesar Chavez Middle School, and James Logan High School.
Ownership History
Date
Name
Owned For
Owner Type
Purchase Details
Closed on
Jan 26, 2018
Sold by
Maldonado Raquel
Bought by
Revocabl Maldonado Raquel
Current Estimated Value
Purchase Details
Closed on
Mar 20, 2001
Sold by
Alexander Hutchins Josephine D
Bought by
Maldonado Audon and Maldonado Raquel
Home Financials for this Owner
Home Financials are based on the most recent Mortgage that was taken out on this home.
Original Mortgage
$224,400
Outstanding Balance
$81,405
Interest Rate
6.97%
Mortgage Type
FHA
Estimated Equity
$402,905
Purchase Details
Closed on
Mar 24, 1998
Sold by
Hutchins Charles
Bought by
Alexander Hutchins Josephine D
Home Financials for this Owner
Home Financials are based on the most recent Mortgage that was taken out on this home.
Original Mortgage
$109,716
Interest Rate
7%
Mortgage Type
FHA
Create a Home Valuation Report for This Property
The Home Valuation Report is an in-depth analysis detailing your home's value as well as a comparison with similar homes in the area
Home Values in the Area
Average Home Value in this Area
Purchase History
| Date | Buyer | Sale Price | Title Company |
|---|---|---|---|
| Revocabl Maldonado Raquel | -- | None Available | |
| Maldonado Audon | $231,000 | North American Title Co | |
| Alexander Hutchins Josephine D | -- | First Southwestern Title Co |
Source: Public Records
Mortgage History
| Date | Status | Borrower | Loan Amount |
|---|---|---|---|
| Open | Maldonado Audon | $224,400 | |
| Previous Owner | Alexander Hutchins Josephine D | $109,716 |
Source: Public Records
Tax History Compared to Growth
Tax History
| Year | Tax Paid | Tax Assessment Tax Assessment Total Assessment is a certain percentage of the fair market value that is determined by local assessors to be the total taxable value of land and additions on the property. | Land | Improvement |
|---|---|---|---|---|
| 2025 | $5,453 | $341,054 | $104,416 | $243,638 |
| 2024 | $5,453 | $334,230 | $102,369 | $238,861 |
| 2023 | $5,246 | $334,540 | $100,362 | $234,178 |
| 2022 | $5,137 | $320,982 | $98,394 | $229,588 |
| 2021 | $5,025 | $314,551 | $96,465 | $225,086 |
| 2020 | $4,937 | $318,254 | $95,476 | $222,778 |
| 2019 | $4,976 | $312,015 | $93,604 | $218,411 |
| 2018 | $4,857 | $305,898 | $91,769 | $214,129 |
| 2017 | $4,739 | $299,901 | $89,970 | $209,931 |
| 2016 | $4,565 | $294,023 | $88,207 | $205,816 |
| 2015 | $4,477 | $289,608 | $86,882 | $202,726 |
| 2014 | $3,738 | $236,000 | $70,800 | $165,200 |
Source: Public Records
Map
Nearby Homes
- 2139 Canary Ct Unit 2
- 2221 Partridge Way Unit 3
- 2224 Peacock Place Unit 3
- 2404 Maraschino Place
- 1027 Chalcedony Terrace
- 33852 11th St
- 1793 H St
- 1157 Silver St
- 35990 Copper St
- 34926 Moina Shaiq Common
- 2108 Dalton Way
- 33848 10th St
- 33840 10th St
- 126 Bellflower Ln
- 33721 12th St
- 34237 Torrey Pine Ln
- 2255 Hartford Dr
- 35180 Mount Whitney Terrace
- 1870 Sherman Dr
- 409 King Ave
- 2127 Swan Ct
- 2127 Swan Ct Unit 2
- 2127 Swan Ct Unit 3
- 2127 Swan Ct Unit 4
- 2135 Swan Ct Unit 2
- 2135 Swan Ct
- 2135 Swan Ct
- 2126 Swan Ct Unit 3
- 2126 Swan Ct
- 2126 Swan Ct Unit 4
- 2126 Swan Ct Unit 1
- 2126 Swan Ct Unit 2
- 34709 Alvarado Niles Rd
- 34709 Alvarado Niles Rd Unit 4
- 34709 Alvarado Niles Rd Unit 2
- 34709 Alvarado Niles Rd Unit 1
- 34709 Alvarado Niles Rd Unit 3
- 34701 Alvarado Niles Rd
- 34701 Alvarado Niles Rd
- 34701 Alvarado Niles Rd Unit 1