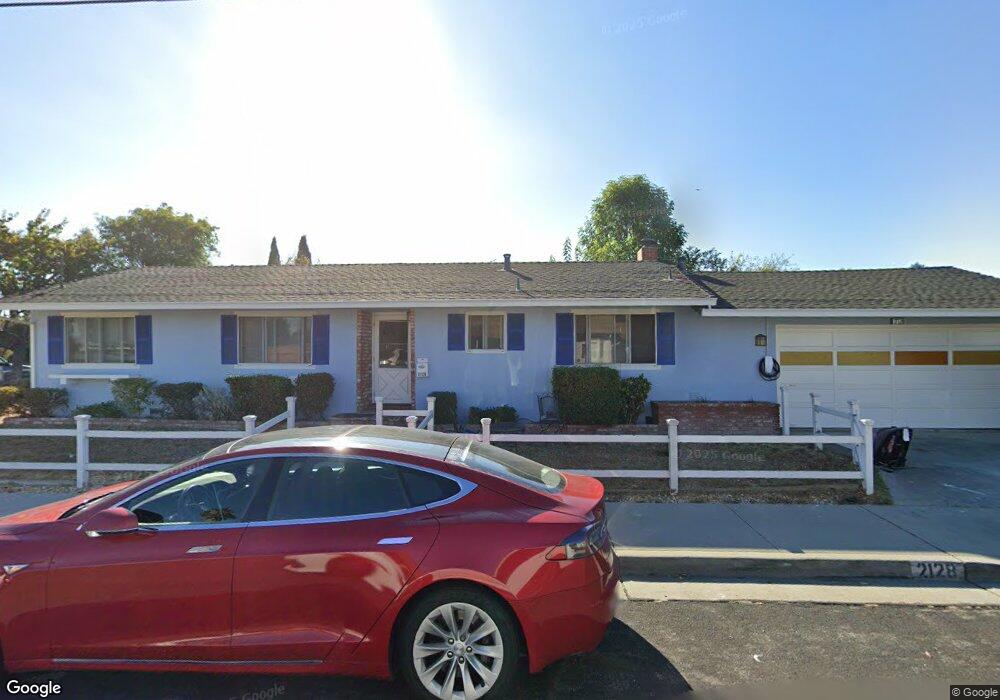
2128 2nd St Santa Clara, CA 95054
North Santa Clara NeighborhoodEstimated Value: $615,000 - $1,405,552
3
Beds
2
Baths
1,246
Sq Ft
$929/Sq Ft
Est. Value
About This Home
This home is located at 2128 2nd St, Santa Clara, CA 95054 and is currently estimated at $1,157,388, approximately $928 per square foot. 2128 2nd St is a home located in Santa Clara County with nearby schools including Kathryn Hughes Elementary School, Buchser Middle School, and Santa Clara High School.
Ownership History
Date
Name
Owned For
Owner Type
Purchase Details
Closed on
Dec 18, 2020
Sold by
Muhammad Saleem and Saleem Saima
Bought by
Muhammad Saleem and Saleem Saima
Current Estimated Value
Home Financials for this Owner
Home Financials are based on the most recent Mortgage that was taken out on this home.
Original Mortgage
$548,000
Outstanding Balance
$398,626
Interest Rate
2.8%
Mortgage Type
New Conventional
Estimated Equity
$758,762
Purchase Details
Closed on
Jul 14, 2020
Sold by
Muhammad Saleem and Saleem Saima
Bought by
Muhammad Saleem and Saleem Saima
Purchase Details
Closed on
Oct 25, 2010
Sold by
Dunn Kirk D and Dunn Malida L
Bought by
Muhammad Saleem and Saleem Saima
Home Financials for this Owner
Home Financials are based on the most recent Mortgage that was taken out on this home.
Original Mortgage
$400,000
Interest Rate
4.33%
Mortgage Type
Purchase Money Mortgage
Purchase Details
Closed on
Jul 15, 1999
Sold by
Brawley Betty J and Brawley Larry D
Bought by
Dunn Kirk D and Dunn Malida L
Home Financials for this Owner
Home Financials are based on the most recent Mortgage that was taken out on this home.
Original Mortgage
$289,000
Interest Rate
10.5%
Create a Home Valuation Report for This Property
The Home Valuation Report is an in-depth analysis detailing your home's value as well as a comparison with similar homes in the area
Home Values in the Area
Average Home Value in this Area
Purchase History
| Date | Buyer | Sale Price | Title Company |
|---|---|---|---|
| Muhammad Saleem | -- | Fidelity National Title | |
| Muhammad Saleem | -- | None Available | |
| Muhammad Saleem | $515,000 | Old Republic Title Company | |
| Dunn Kirk D | $340,000 | Old Republic Title Company |
Source: Public Records
Mortgage History
| Date | Status | Borrower | Loan Amount |
|---|---|---|---|
| Open | Muhammad Saleem | $548,000 | |
| Closed | Muhammad Saleem | $400,000 | |
| Previous Owner | Dunn Kirk D | $289,000 |
Source: Public Records
Tax History Compared to Growth
Tax History
| Year | Tax Paid | Tax Assessment Tax Assessment Total Assessment is a certain percentage of the fair market value that is determined by local assessors to be the total taxable value of land and additions on the property. | Land | Improvement |
|---|---|---|---|---|
| 2025 | $7,657 | $659,792 | $395,878 | $263,914 |
| 2024 | $7,657 | $646,856 | $388,116 | $258,740 |
| 2023 | $7,580 | $634,173 | $380,506 | $253,667 |
| 2022 | $7,455 | $621,740 | $373,046 | $248,694 |
| 2021 | $7,341 | $609,550 | $365,732 | $243,818 |
| 2020 | $7,207 | $603,300 | $361,982 | $241,318 |
| 2019 | $7,197 | $591,472 | $354,885 | $236,587 |
| 2018 | $6,735 | $579,876 | $347,927 | $231,949 |
| 2017 | $6,700 | $568,506 | $341,105 | $227,401 |
| 2016 | $6,578 | $557,360 | $334,417 | $222,943 |
| 2015 | $6,551 | $548,989 | $329,394 | $219,595 |
| 2014 | $6,221 | $538,236 | $322,942 | $215,294 |
Source: Public Records
Map
Nearby Homes
- 4503 Cheeney St
- 2200 Agnew Rd Unit 212
- 2200 Agnew Rd Unit 118
- 1883 Agnew Rd Unit 301
- 1883 Agnew Rd Unit 341
- 1883 Agnew Rd Unit 367
- 4216 Atlantic Ct
- 1752 Beech St
- 1898 Garzoni Place
- 1901 Garzoni Place Unit 405
- 4676 Wilcox Ave
- 1900 Chestnut St
- 4699 Snead Dr
- 2313 Villa Place
- 930 Clyde Ave
- 920 Clyde Ave
- 4464 Laird Cir
- 783 Laurie Ave
- 4012 Fitzpatrick Way Unit 3
- 3901 Lick Mill Blvd Unit 358
- 4384 Cheeney St
- 2149 2nd St
- 4374 Cheeney St
- 4395 Fillmore St
- 4385 Fillmore St
- 4354 Cheeney St
- 4381 Fillmore St
- 4404 Cheeney St
- 4393 Cheeney St
- 4383 Cheeney St
- 2159 2nd St
- 2169 2nd St
- 4379 Fillmore St
- 4344 Cheeney St
- 4373 Cheeney St
- 4403 Cheeney St
- 4426 Cheeney St
- 4353 Cheeney St
- 4345 Fillmore St
- 4334 Cheeney St