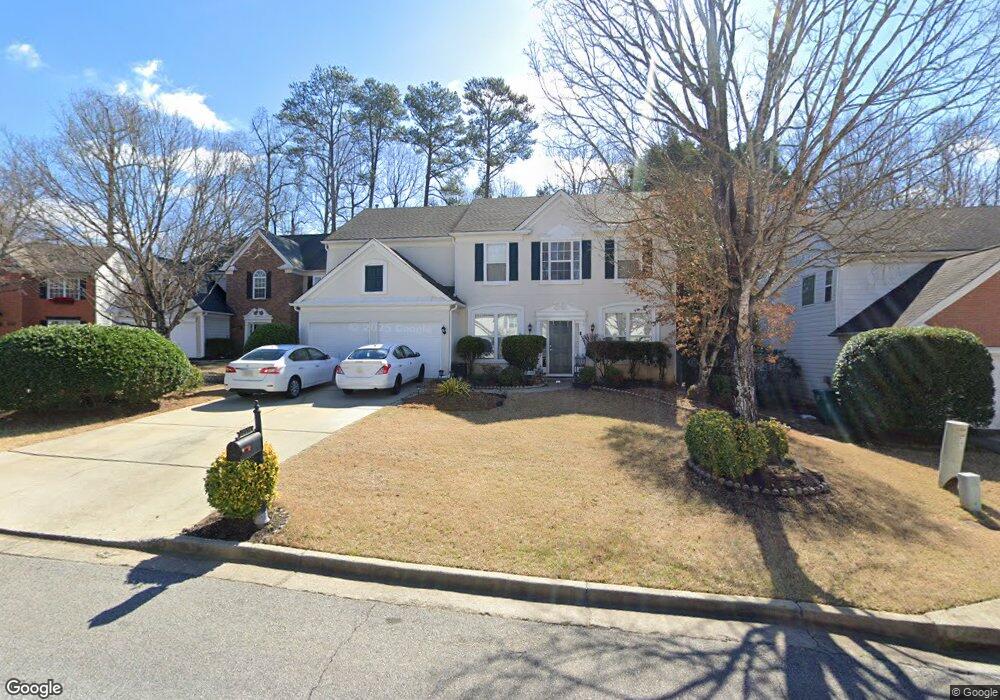
2128 Adderbury Ln SW Smyrna, GA 30082
Estimated Value: $501,195 - $571,000
4
Beds
3
Baths
2,417
Sq Ft
$222/Sq Ft
Est. Value
About This Home
This home is located at 2128 Adderbury Ln SW, Smyrna, GA 30082 and is currently estimated at $537,049, approximately $222 per square foot. 2128 Adderbury Ln SW is a home located in Cobb County with nearby schools including King Springs Elementary School, Griffin Middle School, and Campbell High School.
Ownership History
Date
Name
Owned For
Owner Type
Purchase Details
Closed on
Sep 3, 1999
Sold by
Ogle Bradley B
Bought by
Ogle Bradley B and Ogle Ronwynne I
Current Estimated Value
Home Financials for this Owner
Home Financials are based on the most recent Mortgage that was taken out on this home.
Original Mortgage
$173,436
Outstanding Balance
$49,234
Interest Rate
7.73%
Mortgage Type
New Conventional
Estimated Equity
$487,815
Purchase Details
Closed on
Aug 13, 1999
Sold by
Pulte Home Corp
Bought by
Ogle Bradley B
Home Financials for this Owner
Home Financials are based on the most recent Mortgage that was taken out on this home.
Original Mortgage
$173,436
Outstanding Balance
$49,234
Interest Rate
7.73%
Mortgage Type
New Conventional
Estimated Equity
$487,815
Create a Home Valuation Report for This Property
The Home Valuation Report is an in-depth analysis detailing your home's value as well as a comparison with similar homes in the area
Home Values in the Area
Average Home Value in this Area
Purchase History
| Date | Buyer | Sale Price | Title Company |
|---|---|---|---|
| Ogle Bradley B | -- | -- | |
| Ogle Bradley B | $182,600 | -- |
Source: Public Records
Mortgage History
| Date | Status | Borrower | Loan Amount |
|---|---|---|---|
| Open | Ogle Bradley B | $173,436 |
Source: Public Records
Tax History Compared to Growth
Tax History
| Year | Tax Paid | Tax Assessment Tax Assessment Total Assessment is a certain percentage of the fair market value that is determined by local assessors to be the total taxable value of land and additions on the property. | Land | Improvement |
|---|---|---|---|---|
| 2025 | $4,629 | $196,384 | $38,000 | $158,384 |
| 2024 | $4,629 | $196,384 | $38,000 | $158,384 |
| 2023 | $3,467 | $160,368 | $28,000 | $132,368 |
| 2022 | $3,986 | $160,368 | $28,000 | $132,368 |
| 2021 | $3,991 | $145,180 | $28,000 | $117,180 |
| 2020 | $3,781 | $137,552 | $28,000 | $109,552 |
| 2019 | $3,279 | $119,296 | $26,000 | $93,296 |
| 2018 | $3,279 | $119,296 | $26,000 | $93,296 |
| 2017 | $2,617 | $101,492 | $26,000 | $75,492 |
| 2016 | $2,617 | $101,492 | $26,000 | $75,492 |
| 2015 | $2,402 | $90,988 | $24,000 | $66,988 |
| 2014 | $2,425 | $90,988 | $0 | $0 |
Source: Public Records
Map
Nearby Homes
- 1375 Mosswood Ln SE
- 63 Geraldine Dr SE
- 14 Geraldine Dr SE
- 22 Geraldine Dr SE
- 18 Geraldine Dr SE
- 2508 Haddenham Ln SW
- 203 Angla Dr SE
- 321 Covered Bridge Place SW
- 3808 Concord Approach Way SE
- 22 Vanessa Dr SE Unit 8
- 362 Doeskin Ln SE
- 4135 Fawn Ln SE
- 4025 Benell Ct SE
- 524 Tackett Farms Rd
- 3664 Nessa Ct SE
- 4094 Norton Place SE
- 4066 Covered Bridge Rd SW
- 317 Highview Dr SE
- 4195 Antler Trail SE
- 4246 Antler Trail SE
- 2126 Adderbury Ln SW
- 2130 Adderbury Ln SW
- 2132 Adderbury Ln SW
- 2134 Adderbury Ln SW
- 2129 Adderbury Ln SW
- 3972 Harmony Walk Way SE
- 2125 Adderbury Ln SW
- 2127 Adderbury Ln SW
- 2131 Adderbury Ln SW Unit 2
- 2131 Adderbury Ln SW
- 2136 Adderbury Ln SW
- 3970 Harmony Walk Way SE Unit 1
- 2122 Adderbury Ln SW
- 2135 Adderbury Ln SW
- 2123 Adderbury Ln SW
- 3968 Harmony Walk Way SE
- 0 Harmony Walk Way Unit 3290476
- 0 Harmony Walk Way Unit 8813455
- 0 Harmony Walk Way Unit 7062086
- 0 Harmony Walk Way Unit 7178844