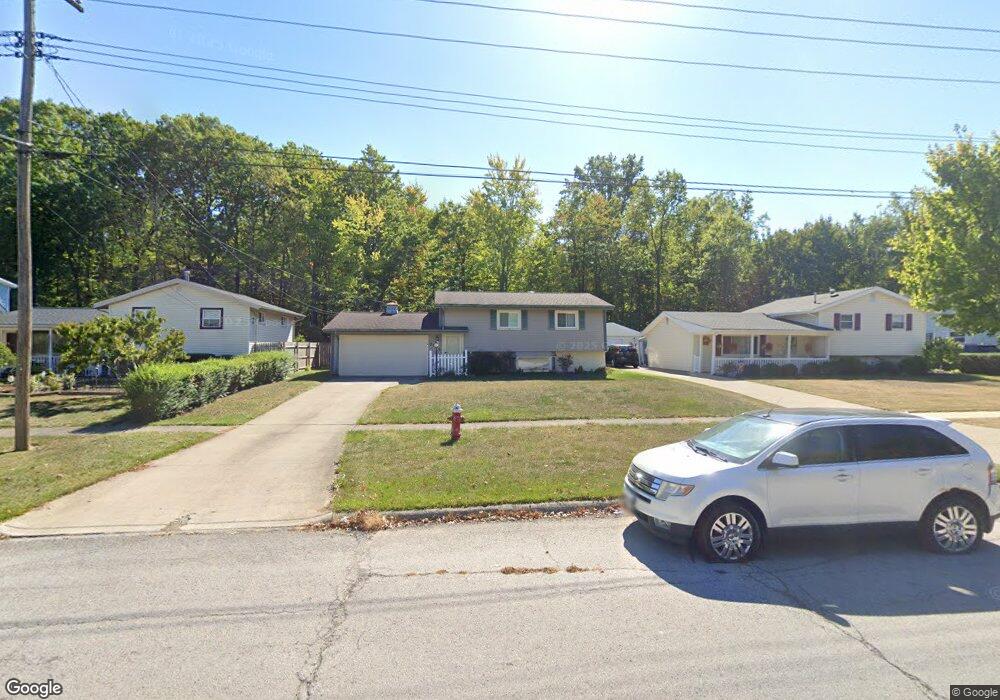
2128 E 42nd St Lorain, OH 44055
Estimated Value: $162,000 - $176,000
3
Beds
3
Baths
1,380
Sq Ft
$122/Sq Ft
Est. Value
About This Home
This home is located at 2128 E 42nd St, Lorain, OH 44055 and is currently estimated at $168,899, approximately $122 per square foot. 2128 E 42nd St is a home located in Lorain County with nearby schools including Helen Steiner Rice Elementary School, Southview Middle School, and Lorain High School.
Ownership History
Date
Name
Owned For
Owner Type
Purchase Details
Closed on
Apr 25, 2024
Sold by
Hernandez Hernan Raul and Gonzalez-Hernandez Noemi
Bought by
Cancel Jason James
Current Estimated Value
Home Financials for this Owner
Home Financials are based on the most recent Mortgage that was taken out on this home.
Original Mortgage
$147,184
Outstanding Balance
$145,065
Interest Rate
6.74%
Mortgage Type
FHA
Estimated Equity
$23,834
Purchase Details
Closed on
Aug 31, 2020
Sold by
Hernandez Hernan R
Bought by
Hernandez Hernan Raul and Gonzalez Hernandez Noemi
Purchase Details
Closed on
Oct 27, 2016
Sold by
Feigenbaum Carole J
Bought by
Hernandez Hernan R
Home Financials for this Owner
Home Financials are based on the most recent Mortgage that was taken out on this home.
Original Mortgage
$50,400
Interest Rate
3.48%
Mortgage Type
New Conventional
Create a Home Valuation Report for This Property
The Home Valuation Report is an in-depth analysis detailing your home's value as well as a comparison with similar homes in the area
Home Values in the Area
Average Home Value in this Area
Purchase History
| Date | Buyer | Sale Price | Title Company |
|---|---|---|---|
| Cancel Jason James | $149,900 | None Listed On Document | |
| Hernandez Hernan Raul | -- | None Available | |
| Hernandez Hernan R | $63,000 | First American Title |
Source: Public Records
Mortgage History
| Date | Status | Borrower | Loan Amount |
|---|---|---|---|
| Open | Cancel Jason James | $147,184 | |
| Previous Owner | Hernandez Hernan R | $50,400 |
Source: Public Records
Tax History
| Year | Tax Paid | Tax Assessment Tax Assessment Total Assessment is a certain percentage of the fair market value that is determined by local assessors to be the total taxable value of land and additions on the property. | Land | Improvement |
|---|---|---|---|---|
| 2024 | $1,402 | $43,810 | $5,527 | $38,283 |
| 2023 | $1,151 | $31,504 | $6,157 | $25,347 |
| 2022 | $1,162 | $31,504 | $6,157 | $25,347 |
| 2021 | $1,162 | $31,504 | $6,157 | $25,347 |
| 2020 | $977 | $25,370 | $4,960 | $20,410 |
| 2019 | $971 | $25,370 | $4,960 | $20,410 |
| 2018 | $972 | $25,370 | $4,960 | $20,410 |
| 2017 | $877 | $22,900 | $5,920 | $16,980 |
| 2016 | $870 | $22,900 | $5,920 | $16,980 |
| 2015 | $821 | $22,900 | $5,920 | $16,980 |
| 2014 | $762 | $21,910 | $5,660 | $16,250 |
| 2013 | $756 | $21,910 | $5,660 | $16,250 |
Source: Public Records
Map
Nearby Homes
- 2108 E 41st St
- 2119 E 41st St
- V/L Grove Ave
- V/L Clinton Ave
- 3934 Gary Ave
- 1951 E 39th St
- 4223 Palm Ave
- 1886 Homewood Dr
- 1863 E 37th St
- 2217 E 32nd St
- 4411 Tacoma Ave
- 4721 Andover Ave
- 4217 Camden Ave
- 3641 Tacoma Ave
- V/L Pearl Ave
- VL Ridgewood St
- 2066 E 30th St
- 2440 E 32nd St
- 4434 Riverside Dr
- 4510 Riverside Dr
Your Personal Tour Guide
Ask me questions while you tour the home.