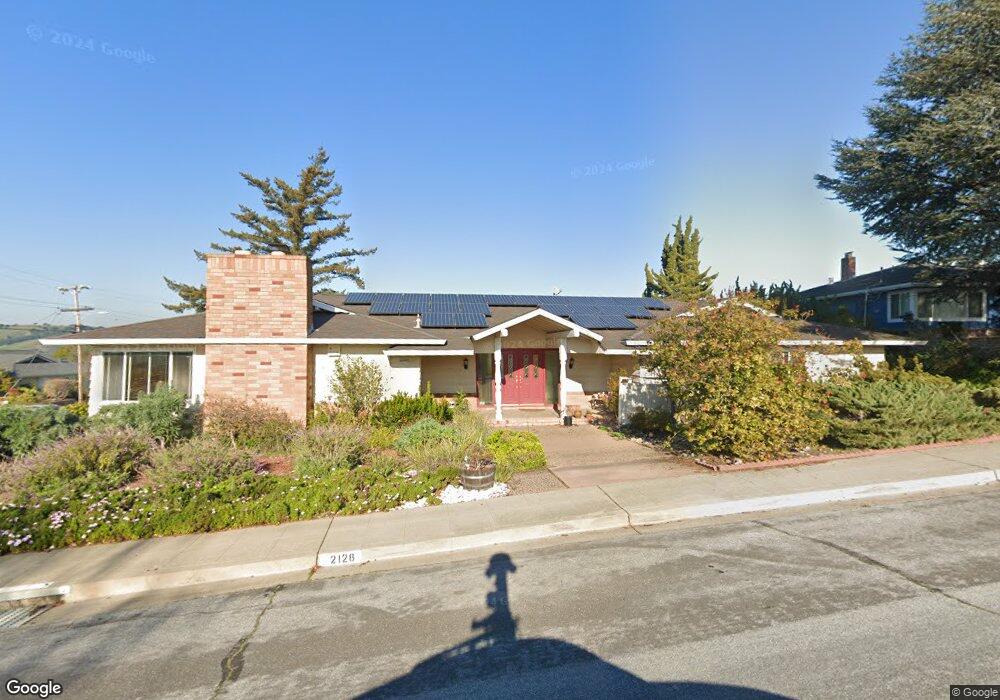
2128 Longview Dr San Leandro, CA 94577
Bay-O-Vista NeighborhoodEstimated Value: $1,221,000 - $1,796,000
6
Beds
3
Baths
3,850
Sq Ft
$390/Sq Ft
Est. Value
About This Home
This home is located at 2128 Longview Dr, San Leandro, CA 94577 and is currently estimated at $1,502,765, approximately $390 per square foot. 2128 Longview Dr is a home located in Alameda County with nearby schools including Roosevelt Elementary School, Bancroft Middle School, and San Leandro High School.
Ownership History
Date
Name
Owned For
Owner Type
Purchase Details
Closed on
Aug 25, 1999
Sold by
Yi Joseph
Bought by
Daly Gregg F and Daly Tanya S
Current Estimated Value
Home Financials for this Owner
Home Financials are based on the most recent Mortgage that was taken out on this home.
Original Mortgage
$371,200
Outstanding Balance
$115,850
Interest Rate
8.75%
Estimated Equity
$1,386,915
Purchase Details
Closed on
Apr 15, 1997
Sold by
Chan Frankie and Chan Kandy
Bought by
Yi Joseph
Home Financials for this Owner
Home Financials are based on the most recent Mortgage that was taken out on this home.
Original Mortgage
$316,450
Interest Rate
7.87%
Purchase Details
Closed on
Jul 15, 1996
Sold by
Law William
Bought by
Szeto Kit Ling
Create a Home Valuation Report for This Property
The Home Valuation Report is an in-depth analysis detailing your home's value as well as a comparison with similar homes in the area
Home Values in the Area
Average Home Value in this Area
Purchase History
| Date | Buyer | Sale Price | Title Company |
|---|---|---|---|
| Daly Gregg F | $464,000 | Old Republic Title Company | |
| Yi Joseph | $352,000 | North American Title Co | |
| Szeto Kit Ling | -- | First American Title Guarant |
Source: Public Records
Mortgage History
| Date | Status | Borrower | Loan Amount |
|---|---|---|---|
| Open | Daly Gregg F | $371,200 | |
| Previous Owner | Yi Joseph | $316,450 | |
| Closed | Daly Gregg F | $92,800 |
Source: Public Records
Tax History
| Year | Tax Paid | Tax Assessment Tax Assessment Total Assessment is a certain percentage of the fair market value that is determined by local assessors to be the total taxable value of land and additions on the property. | Land | Improvement |
|---|---|---|---|---|
| 2025 | $9,413 | $706,116 | $213,935 | $499,181 |
| 2024 | $9,413 | $692,135 | $209,740 | $489,395 |
| 2023 | $9,349 | $685,430 | $205,629 | $479,801 |
| 2022 | $9,089 | $664,991 | $201,597 | $470,394 |
| 2021 | $8,807 | $651,818 | $197,645 | $461,173 |
| 2020 | $8,579 | $652,067 | $195,620 | $456,447 |
| 2019 | $8,326 | $639,284 | $191,785 | $447,499 |
| 2018 | $8,115 | $626,751 | $188,025 | $438,726 |
| 2017 | $7,957 | $614,465 | $184,339 | $430,126 |
| 2016 | $7,542 | $602,420 | $180,726 | $421,694 |
| 2015 | $7,408 | $593,371 | $178,011 | $415,360 |
| 2014 | $7,349 | $581,748 | $174,524 | $407,224 |
Source: Public Records
Map
Nearby Homes
- 1269 Gabriel Ct
- 1449 Sandelin Ave
- 0 Montrose Dr
- 890 Linwood Way
- 1468 Grand Ave Unit 5
- 1468 Grand Ave Unit 21
- 14670 Midland Rd
- 970 Joaquin Ave Unit U7
- 976 Collier Dr
- 3247 Revere Ave
- 14644 Saturn Dr
- 3175 Revere Ave
- 0 Saturn Dr
- 2245 Sol St
- 0 Revere Ave Unit 41116016
- 1550 Bancroft Ave Unit 112
- 1053 San Jose St
- 1316 135th Ave
- 14831 Bancroft Ave Unit Space 27
- 456 Lewis Ave
- 2111 Lakeview Dr
- 1800 Skyview Dr
- 1789 Skyview Dr
- 2168 Longview Dr
- 2137 Longview Dr
- 1822 Skyview Dr
- 2177 Lakeview Dr
- 2139 Lakeview Dr
- 1780 Skyview Dr
- 2175 Longview Dr
- 2030 Longview Dr
- 2240 Longview Dr
- 2112 Lakeview Dr
- 2122 Harborview Dr
- 2225 Lakeview Dr
- 2130 Lakeview Dr
- 2146 Harborview Dr
- 2071 Longview Dr
- 1958 Longview Dr
- 2261 Longview Dr
Your Personal Tour Guide
Ask me questions while you tour the home.