Estimated Value: $149,000 - $212,000
4
Beds
1
Bath
1,637
Sq Ft
$112/Sq Ft
Est. Value
About This Home
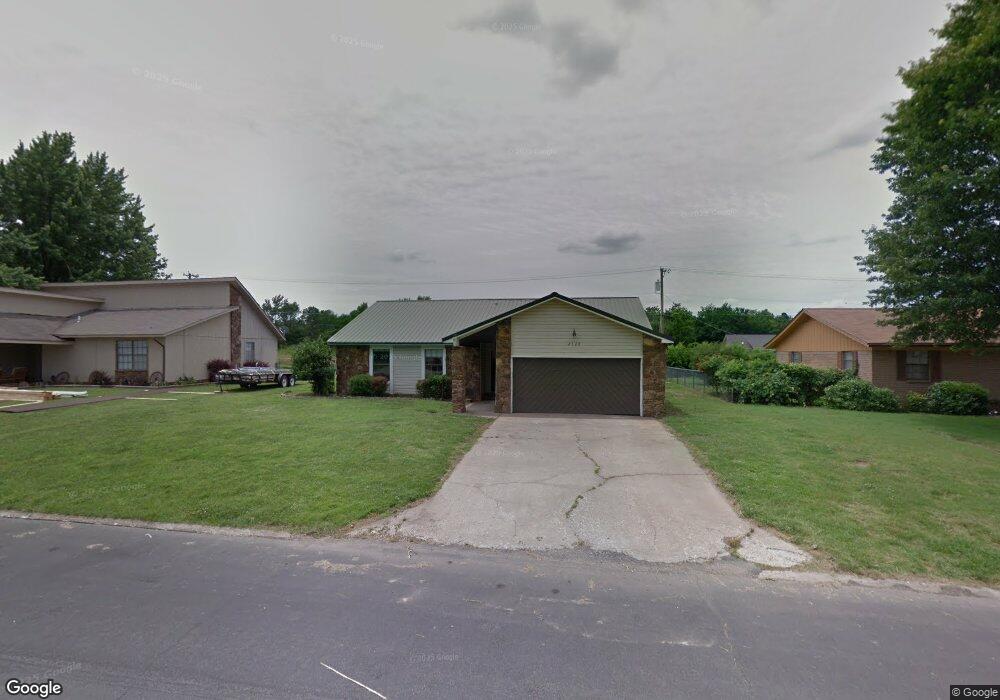
This home is located at 2128 M St SW, Miami, OK 74354 and is currently estimated at $184,148, approximately $112 per square foot. 2128 M St SW is a home located in Ottawa County with nearby schools including Miami High School.
Ownership History
Date
Name
Owned For
Owner Type
Purchase Details
Closed on
Aug 23, 2013
Sold by
Rogers Jesse B and Rogers Kirby R
Bought by
Rogers Jesse B and Rogers Kirby R
Current Estimated Value
Home Financials for this Owner
Home Financials are based on the most recent Mortgage that was taken out on this home.
Original Mortgage
$47,600
Outstanding Balance
$35,595
Interest Rate
4.53%
Mortgage Type
Future Advance Clause Open End Mortgage
Estimated Equity
$148,553
Purchase Details
Closed on
Aug 21, 2013
Sold by
Jpmorgan Chase Bank Na
Bought by
Rogers Jesse B and Rogers Kirby R
Home Financials for this Owner
Home Financials are based on the most recent Mortgage that was taken out on this home.
Original Mortgage
$47,600
Outstanding Balance
$35,595
Interest Rate
4.53%
Mortgage Type
Future Advance Clause Open End Mortgage
Estimated Equity
$148,553
Purchase Details
Closed on
Apr 21, 2013
Bought by
Jp Morgan Chase Bank
Purchase Details
Closed on
Nov 6, 2002
Bought by
Holcom Eric and Holcom Theresa
Create a Home Valuation Report for This Property
The Home Valuation Report is an in-depth analysis detailing your home's value as well as a comparison with similar homes in the area
Home Values in the Area
Average Home Value in this Area
Purchase History
| Date | Buyer | Sale Price | Title Company |
|---|---|---|---|
| Rogers Jesse B | -- | Ottawa County Abstract & Tit | |
| Rogers Jesse B | $59,500 | None Available | |
| Jp Morgan Chase Bank | -- | -- | |
| Jpmorgan Chase Bank Na | $86,480 | None Available | |
| Holcom Eric | $70,000 | -- |
Source: Public Records
Mortgage History
| Date | Status | Borrower | Loan Amount |
|---|---|---|---|
| Open | Rogers Jesse B | $47,600 |
Source: Public Records
Tax History Compared to Growth
Tax History
| Year | Tax Paid | Tax Assessment Tax Assessment Total Assessment is a certain percentage of the fair market value that is determined by local assessors to be the total taxable value of land and additions on the property. | Land | Improvement |
|---|---|---|---|---|
| 2024 | $962 | $10,984 | $1,254 | $9,730 |
| 2023 | $962 | $10,664 | $1,254 | $9,410 |
| 2022 | $865 | $10,354 | $1,254 | $9,100 |
| 2021 | $855 | $10,052 | $1,254 | $8,798 |
| 2020 | $835 | $9,760 | $1,254 | $8,506 |
| 2019 | $696 | $9,475 | $1,254 | $8,221 |
| 2018 | $700 | $9,475 | $1,254 | $8,221 |
| 2017 | $712 | $9,475 | $1,254 | $8,221 |
| 2016 | $700 | $9,712 | $1,254 | $8,458 |
| 2015 | $709 | $7,980 | $610 | $7,370 |
| 2014 | $697 | $9,514 | $1,198 | $8,316 |
Source: Public Records
Map
Nearby Homes
- 2110 M St SW
- 2216 M St SW
- 1101 22nd Place SW
- 1025 22nd Ave SW
- 1133 Sunset Strip
- 2325 J St SW
- 0 24th Ave SW
- TBD 24th Ave SW
- 805 23rd Ave SW
- 0 E 130 Rd Unit 22-974
- Tract 3 U S 59
- 404 16th Place SW
- 1425 E St SW
- 11009 S 540 Rd
- 12900 S Highway 69
- 712 C St SE
- 616 D St SE
- 301 B St SE
- 107 D St NE
- 57040 E 131 Rd