2128 W 2175 S Syracuse, UT 84075
Estimated Value: $387,000 - $439,000
3
Beds
1
Bath
1,236
Sq Ft
$328/Sq Ft
Est. Value
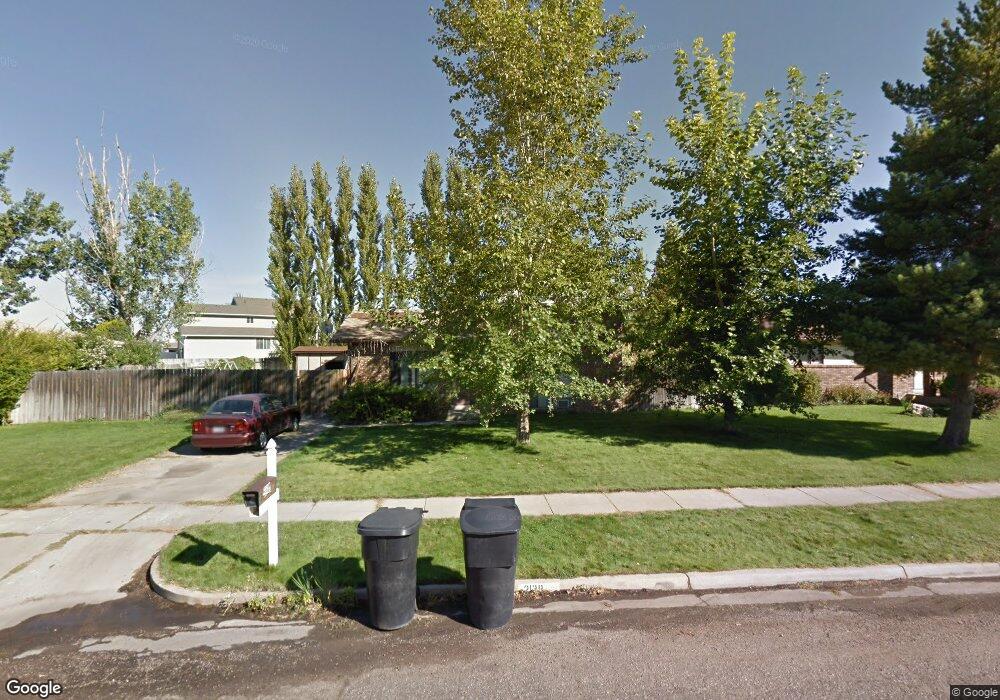
About This Home
This home is located at 2128 W 2175 S, Syracuse, UT 84075 and is currently estimated at $404,797, approximately $327 per square foot. 2128 W 2175 S is a home located in Davis County with nearby schools including Syracuse Elementary School, Syracuse Junior High School, and Syracuse High School.
Ownership History
Date
Name
Owned For
Owner Type
Purchase Details
Closed on
Feb 5, 2003
Sold by
Aaron Joseph
Bought by
Aaron Joseph and Aaron Tiffiny K
Current Estimated Value
Home Financials for this Owner
Home Financials are based on the most recent Mortgage that was taken out on this home.
Original Mortgage
$99,931
Outstanding Balance
$42,041
Interest Rate
5.83%
Mortgage Type
FHA
Estimated Equity
$362,756
Purchase Details
Closed on
Feb 12, 2002
Sold by
Menges Christine M
Bought by
Aaron Joseph
Home Financials for this Owner
Home Financials are based on the most recent Mortgage that was taken out on this home.
Original Mortgage
$98,455
Interest Rate
7.13%
Mortgage Type
FHA
Purchase Details
Closed on
Jan 30, 2002
Sold by
Aaron Joseph
Bought by
Aaron Joseph and Aaron Tiffiny K
Home Financials for this Owner
Home Financials are based on the most recent Mortgage that was taken out on this home.
Original Mortgage
$98,455
Interest Rate
7.13%
Mortgage Type
FHA
Create a Home Valuation Report for This Property
The Home Valuation Report is an in-depth analysis detailing your home's value as well as a comparison with similar homes in the area
Home Values in the Area
Average Home Value in this Area
Purchase History
| Date | Buyer | Sale Price | Title Company |
|---|---|---|---|
| Aaron Joseph | -- | Executive Title Insurance Ag | |
| Aaron Joseph | -- | First American Title Insuran | |
| Aaron Joseph | -- | Us Title |
Source: Public Records
Mortgage History
| Date | Status | Borrower | Loan Amount |
|---|---|---|---|
| Open | Aaron Joseph | $99,931 | |
| Closed | Aaron Joseph | $98,455 |
Source: Public Records
Tax History Compared to Growth
Tax History
| Year | Tax Paid | Tax Assessment Tax Assessment Total Assessment is a certain percentage of the fair market value that is determined by local assessors to be the total taxable value of land and additions on the property. | Land | Improvement |
|---|---|---|---|---|
| 2025 | $1,910 | $184,250 | $123,707 | $60,543 |
| 2024 | $1,869 | $181,500 | $101,129 | $80,371 |
| 2023 | $1,735 | $307,000 | $140,978 | $166,022 |
| 2022 | $1,859 | $180,400 | $81,315 | $99,085 |
| 2021 | $1,684 | $253,000 | $120,031 | $132,969 |
| 2020 | $1,499 | $218,000 | $105,154 | $112,846 |
| 2019 | $1,470 | $211,000 | $102,057 | $108,943 |
| 2018 | $1,333 | $190,000 | $98,955 | $91,045 |
| 2016 | $1,086 | $81,125 | $38,008 | $43,117 |
| 2015 | $1,071 | $76,230 | $38,008 | $38,222 |
| 2014 | $810 | $58,734 | $38,008 | $20,726 |
| 2013 | -- | $77,316 | $29,779 | $47,537 |
Source: Public Records
Map
Nearby Homes
- 2104 W 2200 S
- 2136 W 2200 S
- 2237 Craig Ln
- 2297 W 2175 S
- 1932 S 2150 W
- 2194 S 1800 W
- 2082 S 1730 W
- 4344 W 1825 S Unit 102
- 4354 W 1825 S Unit 104
- 4348 W 1825 S Unit 103
- 2503 S 1875 W
- 2208 W 2615 S Unit 141
- 2198 W 2615 S Unit 140
- 2158 W 2615 S Unit 137
- 2650 S 2000 W
- 2154 W 2700 S
- 2402 W 2700 S
- 2236 S 2685 W
- Bridgeport Plan at Sadie's Glenn
- Sullivan Plan at Sadie's Glenn