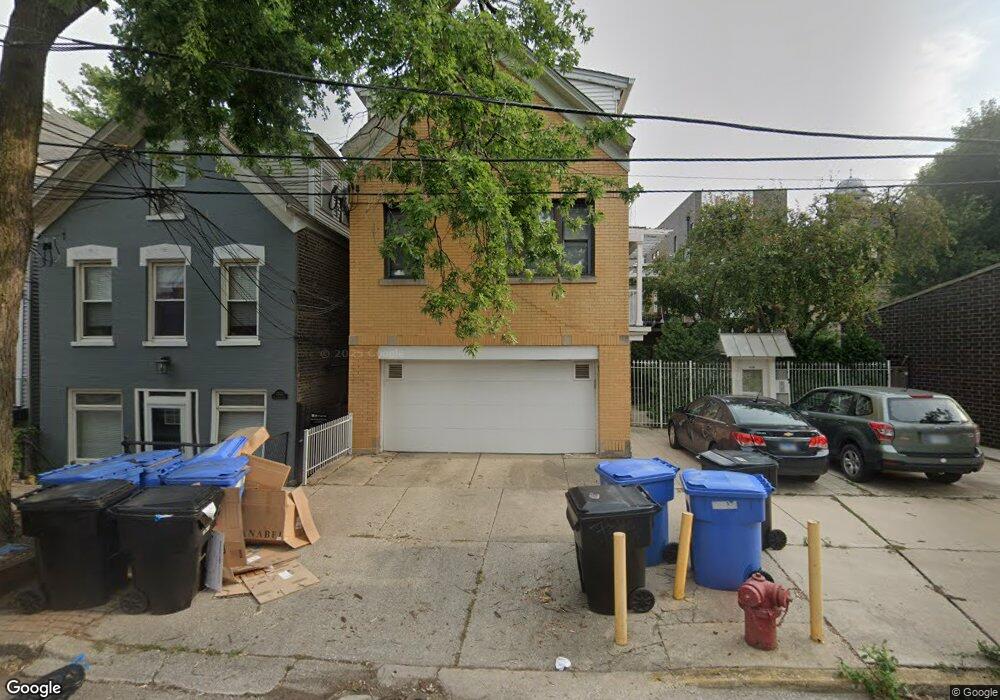
2128 W Shakespeare Ave Unit C2 Chicago, IL 60647
Bucktown NeighborhoodEstimated Value: $537,000 - $805,000
--
Bed
--
Bath
13,833
Sq Ft
$49/Sq Ft
Est. Value
About This Home
This home is located at 2128 W Shakespeare Ave Unit C2, Chicago, IL 60647 and is currently estimated at $672,781, approximately $48 per square foot. 2128 W Shakespeare Ave Unit C2 is a home located in Cook County with nearby schools including Pulaski Intl School of Chicago, Clemente Community Academy High School, and CICS - Bucktown Campus.
Ownership History
Date
Name
Owned For
Owner Type
Purchase Details
Closed on
Jul 28, 2010
Sold by
Hegarty Laurence P and Hooper Elizabeth A
Bought by
Hegarty Laurence P and Hooper Elizabeth A
Current Estimated Value
Purchase Details
Closed on
Jul 15, 2002
Sold by
Becher David A and Lochner Eric E
Bought by
Hegarty Laurence and Hooper Elizabeth
Home Financials for this Owner
Home Financials are based on the most recent Mortgage that was taken out on this home.
Original Mortgage
$290,000
Interest Rate
6.79%
Mortgage Type
Purchase Money Mortgage
Purchase Details
Closed on
Nov 21, 1997
Sold by
Isaacson Patricia
Bought by
Becher David A and Lochner Eric E
Home Financials for this Owner
Home Financials are based on the most recent Mortgage that was taken out on this home.
Original Mortgage
$285,750
Interest Rate
6.12%
Mortgage Type
Purchase Money Mortgage
Create a Home Valuation Report for This Property
The Home Valuation Report is an in-depth analysis detailing your home's value as well as a comparison with similar homes in the area
Home Values in the Area
Average Home Value in this Area
Purchase History
| Date | Buyer | Sale Price | Title Company |
|---|---|---|---|
| Hegarty Laurence P | -- | None Available | |
| Hegarty Laurence | $575,000 | -- | |
| Becher David A | $317,500 | -- |
Source: Public Records
Mortgage History
| Date | Status | Borrower | Loan Amount |
|---|---|---|---|
| Closed | Hegarty Laurence | $290,000 | |
| Previous Owner | Becher David A | $285,750 |
Source: Public Records
Tax History Compared to Growth
Tax History
| Year | Tax Paid | Tax Assessment Tax Assessment Total Assessment is a certain percentage of the fair market value that is determined by local assessors to be the total taxable value of land and additions on the property. | Land | Improvement |
|---|---|---|---|---|
| 2024 | $11,687 | $50,682 | $11,124 | $39,558 |
| 2023 | $11,391 | $55,195 | $5,818 | $49,377 |
| 2022 | $11,391 | $55,195 | $5,818 | $49,377 |
| 2021 | $11,135 | $55,193 | $5,817 | $49,376 |
| 2020 | $10,768 | $48,161 | $5,817 | $42,344 |
| 2019 | $10,592 | $52,531 | $5,817 | $46,714 |
| 2018 | $10,377 | $52,531 | $5,817 | $46,714 |
| 2017 | $10,710 | $49,751 | $5,114 | $44,637 |
| 2016 | $9,965 | $49,751 | $5,114 | $44,637 |
| 2015 | $11,996 | $65,462 | $5,114 | $60,348 |
| 2014 | $7,841 | $42,261 | $4,538 | $37,723 |
| 2013 | $7,686 | $42,261 | $4,538 | $37,723 |
Source: Public Records
Map
Nearby Homes
- 2224 N Seeley Ave Unit 2
- 2035 W Charleston St Unit 405
- 2136 W Lyndale St Unit 2
- 2012 W Charleston St
- 2138 N Damen Ave Unit 4
- 2138 N Damen Ave Unit 2
- 2144 N Bell Ave
- 2320 N Hamilton Ave Unit 1
- 2151 N Oakley Ave
- 2134 N Winchester Ave Unit B
- 1951 W Dickens Ave
- 2246 W Lyndale St Unit 2
- 2135 W Armitage Ave
- 2208 N Oakley Ave Unit 1N
- 2236 W Armitage Ave Unit 303
- 2011 N Oakley Ave
- 2335 N Lister Ave Unit B
- 2032 W Homer St
- 2329 N Oakley Ave Unit 3E
- 1936 W Armitage Ave Unit 3E
- 2128 W Shakespeare Ave Unit A1
- 2128 W Shakespeare Ave Unit B3
- 2128 W Shakespeare Ave Unit A3
- 2128 W Shakespeare Ave Unit A2
- 2132 W Shakespeare Ave
- 2132 W Shakespeare Ave
- 2132 W Shakespeare Ave Unit 2F
- 2125 W Webster Ave
- 2134 W Shakespeare Ave Unit 2
- 2134 W Shakespeare Ave Unit 1
- 2124 W Shakespeare Ave
- 2135 W Webster Ave
- 2136 W Shakespeare Ave
- 2129 W Webster Ave Unit 2
- 2129 W Webster Ave Unit C1
- 2129 W Webster Ave Unit B2
- 2129 W Webster Ave Unit B1C1
- 2129 W Webster Ave Unit B3
- 2129 W Webster Ave Unit B1-C1
- 2129 W Webster Ave Unit 2B