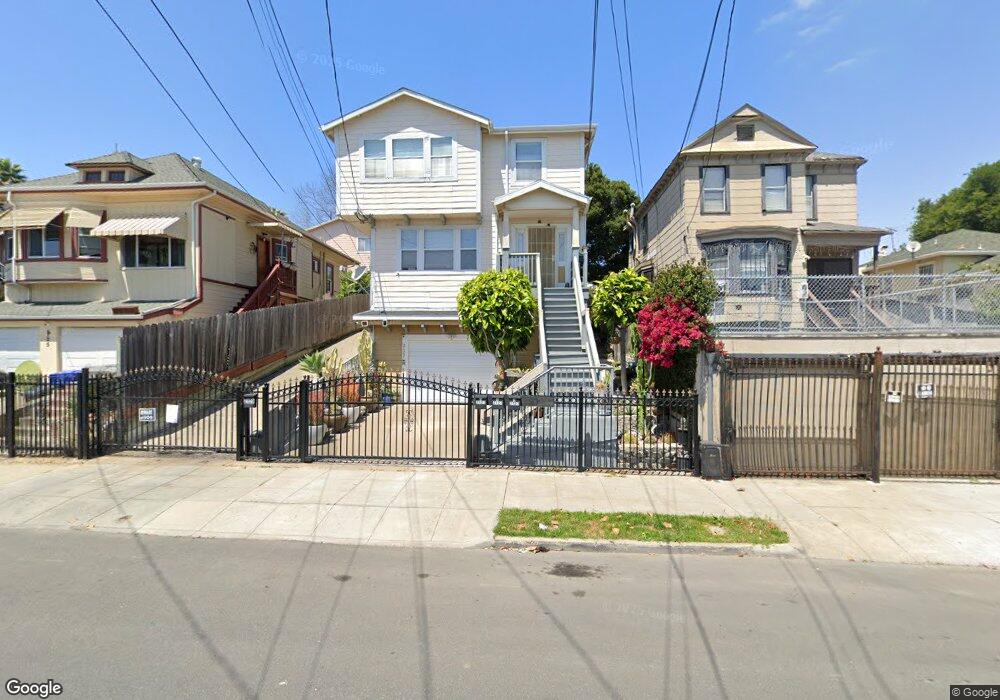
2129 13th Ave Oakland, CA 94606
Clinton NeighborhoodEstimated Value: $603,000 - $1,246,000
12
Beds
5
Baths
5,323
Sq Ft
$174/Sq Ft
Est. Value
About This Home
This home is located at 2129 13th Ave, Oakland, CA 94606 and is currently estimated at $924,500, approximately $173 per square foot. 2129 13th Ave is a home located in Alameda County with nearby schools including Bella Vista Elementary School, Roosevelt Middle School, and Oakland High School.
Ownership History
Date
Name
Owned For
Owner Type
Purchase Details
Closed on
May 23, 2001
Sold by
Chung Irene and Dip Stephanie
Bought by
Chung Irene
Current Estimated Value
Home Financials for this Owner
Home Financials are based on the most recent Mortgage that was taken out on this home.
Original Mortgage
$210,000
Outstanding Balance
$83,149
Interest Rate
8.37%
Estimated Equity
$841,351
Purchase Details
Closed on
Aug 4, 1999
Sold by
Diep Cho Phu
Bought by
Chung Irene
Purchase Details
Closed on
May 6, 1997
Sold by
Leung Wong Yiu Kee and Leung Pui Yu
Bought by
Liang Ming Guang and Li Yin Song
Purchase Details
Closed on
May 9, 1995
Sold by
Wong Yu Kai and Han Leung Shuk
Bought by
Wong Yiu Kee and Wong Pui Yu Leung
Purchase Details
Closed on
Jan 27, 1995
Sold by
Wong Yu Kai and Han Leung Shuk
Bought by
Wong Yu Kai and Han Leung Shuk
Create a Home Valuation Report for This Property
The Home Valuation Report is an in-depth analysis detailing your home's value as well as a comparison with similar homes in the area
Home Values in the Area
Average Home Value in this Area
Purchase History
We collect this data history from publicly available records. To have your information removed, we recommend requesting removal directly through your county’s website.
| Date | Buyer | Sale Price | Title Company |
|---|---|---|---|
| Chung Irene | -- | Financial Title Company | |
| Chung Irene | -- | Commonwealth Land Title Co | |
| Chung Irene | $55,000 | Commonwealth Land Title Co | |
| Liang Ming Guang | $45,000 | Old Republic Title Company | |
| Wong Yiu Kee | $38,000 | Fidelity National Title Ins | |
| Wong Yu Kai | $81,000 | -- |
Source: Public Records
Mortgage History
We collect this data history from publicly available records. To have your information removed, we recommend requesting removal directly through your county’s website.
| Date | Status | Borrower | Loan Amount |
|---|---|---|---|
| Open | Chung Irene | $210,000 |
Source: Public Records
Tax History
| Year | Tax Paid | Tax Assessment Tax Assessment Total Assessment is a certain percentage of the fair market value that is determined by local assessors to be the total taxable value of land and additions on the property. | Land | Improvement |
|---|---|---|---|---|
| 2025 | $12,498 | $751,419 | $73,829 | $677,590 |
| 2024 | $12,498 | $736,690 | $72,382 | $664,308 |
| 2023 | $12,979 | $722,247 | $70,963 | $651,284 |
| 2022 | $12,492 | $708,089 | $69,572 | $638,517 |
| 2021 | $11,765 | $694,206 | $68,208 | $625,998 |
| 2020 | $11,629 | $687,089 | $67,508 | $619,581 |
| 2019 | $11,075 | $673,622 | $66,185 | $607,437 |
| 2018 | $10,841 | $660,418 | $64,887 | $595,531 |
| 2017 | $10,371 | $647,473 | $63,615 | $583,858 |
| 2016 | $10,050 | $634,782 | $62,368 | $572,414 |
| 2015 | $9,991 | $625,251 | $61,432 | $563,819 |
| 2014 | $10,265 | $613,007 | $60,229 | $552,778 |
Source: Public Records
Map
Nearby Homes
- 2141 14th Ave
- 2226 13th Ave
- 1140 E 22nd St
- 2301 12th Ave
- 2006 14th Ave
- 2212 17th Ave
- 1357 E 25th St
- 1328 E 25th St
- 1744 E 22nd St
- 1747 E 22nd St
- 905 E 24th St
- 1737 13th Ave
- 2445 10th Ave
- 2138 19th Ave
- 1364 E 27th St
- 710 E 22nd St Unit 303
- 710 E 22nd St Unit 203
- 2605 9th Ave
- 1806 8th Ave
- 2709 Vallecito Place
Your Personal Tour Guide
Ask me questions while you tour the home.