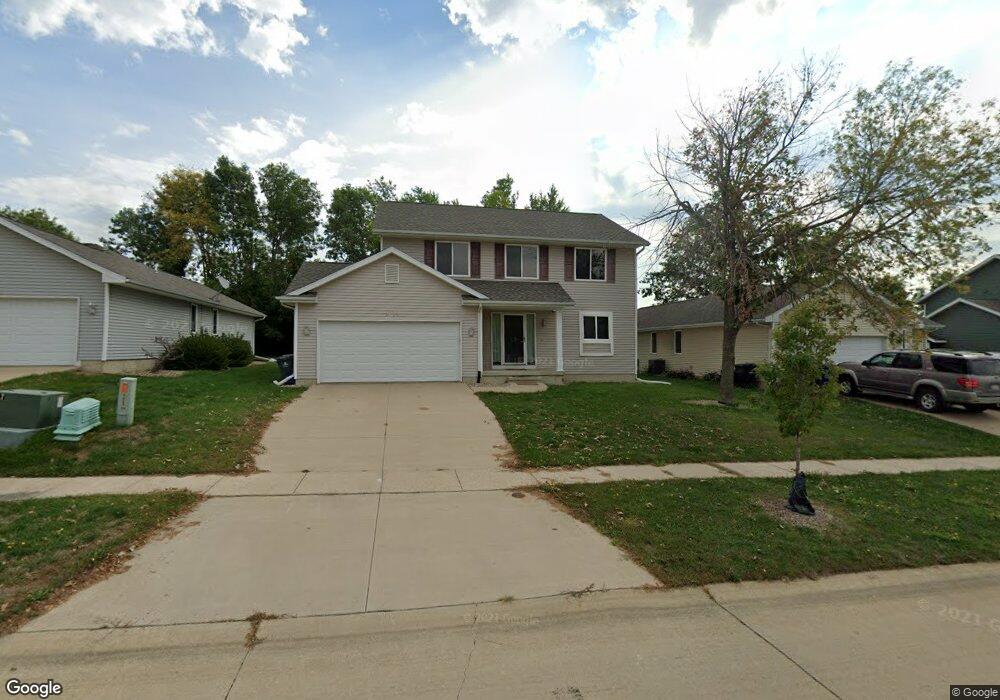
2129 25th St SW Cedar Rapids, IA 52404
Estimated Value: $274,682 - $317,000
4
Beds
3
Baths
1,792
Sq Ft
$161/Sq Ft
Est. Value
About This Home
This home is located at 2129 25th St SW, Cedar Rapids, IA 52404 and is currently estimated at $289,171, approximately $161 per square foot. 2129 25th St SW is a home located in Linn County with nearby schools including Van Buren Elementary School, Wilson Middle School, and Thomas Jefferson High School.
Ownership History
Date
Name
Owned For
Owner Type
Purchase Details
Closed on
Jan 13, 2022
Sold by
Lee and Choon-Foo
Bought by
Kamona Mulonda J and Kalombo Kalunga G
Current Estimated Value
Home Financials for this Owner
Home Financials are based on the most recent Mortgage that was taken out on this home.
Original Mortgage
$221,350
Outstanding Balance
$204,893
Interest Rate
3.45%
Mortgage Type
New Conventional
Estimated Equity
$84,278
Purchase Details
Closed on
Mar 22, 2006
Sold by
Jerrys Homes Inc
Bought by
Khor Choon Foo and Lee Ya Lan
Home Financials for this Owner
Home Financials are based on the most recent Mortgage that was taken out on this home.
Original Mortgage
$134,400
Interest Rate
6.33%
Mortgage Type
Fannie Mae Freddie Mac
Purchase Details
Closed on
Mar 15, 1999
Sold by
R E H Investments Inc and Skalsky Robert C
Bought by
R E H Investments Inc
Create a Home Valuation Report for This Property
The Home Valuation Report is an in-depth analysis detailing your home's value as well as a comparison with similar homes in the area
Purchase History
| Date | Buyer | Sale Price | Title Company |
|---|---|---|---|
| Kamona Mulonda J | $233,000 | None Listed On Document | |
| Khor Choon Foo | $169,500 | None Available | |
| R E H Investments Inc | -- | -- |
Source: Public Records
Mortgage History
| Date | Status | Borrower | Loan Amount |
|---|---|---|---|
| Open | Kamona Mulonda J | $221,350 | |
| Previous Owner | Khor Choon Foo | $134,400 |
Source: Public Records
Tax History
| Year | Tax Paid | Tax Assessment Tax Assessment Total Assessment is a certain percentage of the fair market value that is determined by local assessors to be the total taxable value of land and additions on the property. | Land | Improvement |
|---|---|---|---|---|
| 2025 | $4,284 | $250,200 | $47,000 | $203,200 |
| 2024 | $4,354 | $245,300 | $50,000 | $195,300 |
| 2023 | $4,354 | $252,600 | $45,500 | $207,100 |
| 2022 | $4,278 | $215,300 | $42,400 | $172,900 |
| 2021 | $4,460 | $206,500 | $40,900 | $165,600 |
| 2020 | $4,460 | $202,100 | $30,300 | $171,800 |
| 2019 | $4,008 | $185,900 | $30,300 | $155,600 |
Source: Public Records
Map
Nearby Homes
- 2608 Wilson Ave SW
- 2710 Hickory Dr SW
- 2721 Matthew Dr SW
- 2207 Shady Grove Rd SW
- 2317 Newport Dr SW
- 2103 Shady Grove Rd SW
- 3120 Wilson Ave SW Unit 6
- 2209 Milligan Ct SW
- 3110 Wilson Ave SW Unit 5
- 3110 Wilson Ave SW Unit C11
- 2126 Snapdragon Cir SW
- 3212 Wilson Ave SW
- 1818 Holly Meadow Ave SW
- 1812 Holly Meadow Ave SW
- 2939 12th Ave SW
- 2150 Rockford Rd SW
- 2812 29th Ave SW
- 218 31st St SW
- 3302 12th Ave SW
- 2825 18th St SW
- 2123 25th St SW
- 2135 25th St SW
- 2117 25th St SW
- 2141 25th St SW
- 2120 Probst Ct SW
- 2114 Probst Ct SW
- 2108 Probst Ct SW
- 2126 Probst Ct SW
- 2111 25th St SW
- 2102 Probst Ct SW
- 2110 25th St SW
- 2104 25th St SW
- 2116 25th St SW
- 2026 25th St SW
- 2024 Probst Ct SW
- 2105 25th St SW
- 2122 25th St SW
- 2018 Probst Ct SW
- 2033 25th St SW
- 2119 Probst Ct SW
Your Personal Tour Guide
Ask me questions while you tour the home.