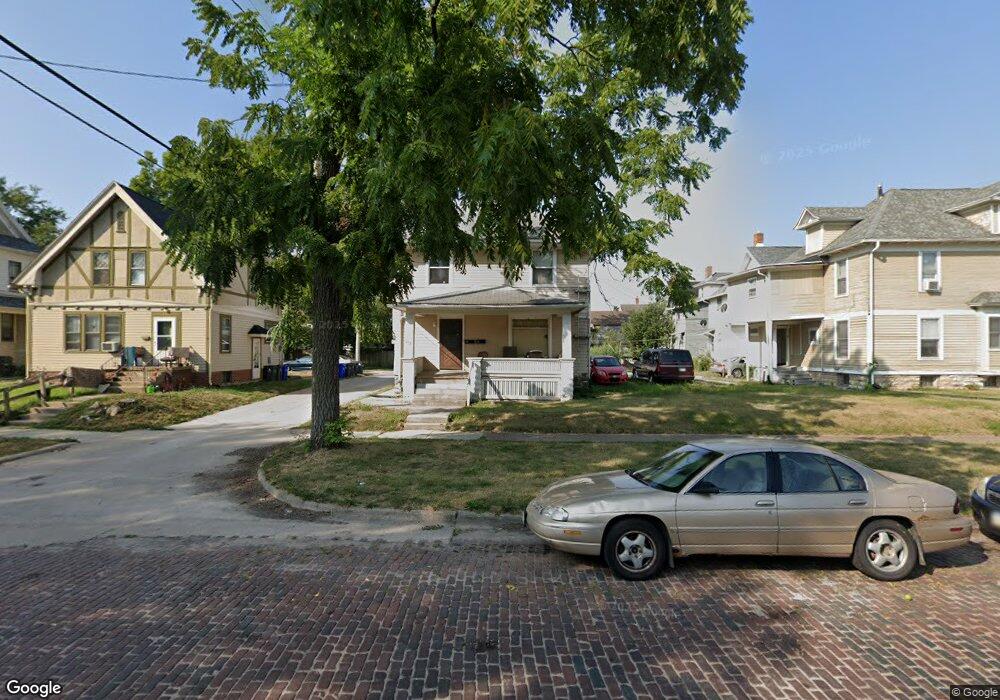
213 16th St SE Cedar Rapids, IA 52403
Wellington Heights NeighborhoodEstimated Value: $160,000 - $186,000
7
Beds
6
Baths
3,604
Sq Ft
$48/Sq Ft
Est. Value
About This Home
This home is located at 213 16th St SE, Cedar Rapids, IA 52403 and is currently estimated at $173,000, approximately $48 per square foot. 213 16th St SE is a home located in Linn County with nearby schools including Johnson STEAM Academy, McKinley STEAM Academy, and George Washington High School.
Ownership History
Date
Name
Owned For
Owner Type
Purchase Details
Closed on
Jan 19, 2024
Sold by
Rosales-Ramirez Felix
Bought by
Martinez-Reyes Felix
Current Estimated Value
Purchase Details
Closed on
Apr 22, 2019
Sold by
Hosseini Aghdas and Hosseini Payam
Bought by
Reyes Felix Martinez and Rosales Ramirez Felix
Purchase Details
Closed on
Jun 6, 2018
Sold by
Hosseini Aghdas
Bought by
Hosseini Aghdas and Hosseini Payam A
Purchase Details
Closed on
Jul 30, 2010
Sold by
Hosseini Rohollah and Hosseini Aghdas
Bought by
Martinez Rosales Ramirez Felix and Martinez Reyes Felix
Home Financials for this Owner
Home Financials are based on the most recent Mortgage that was taken out on this home.
Original Mortgage
$107,020
Interest Rate
4.81%
Mortgage Type
Seller Take Back
Create a Home Valuation Report for This Property
The Home Valuation Report is an in-depth analysis detailing your home's value as well as a comparison with similar homes in the area
Home Values in the Area
Average Home Value in this Area
Purchase History
| Date | Buyer | Sale Price | Title Company |
|---|---|---|---|
| Martinez-Reyes Felix | -- | None Listed On Document | |
| Reyes Felix Martinez | $120,000 | None Available | |
| Hosseini Aghdas | -- | None Available | |
| Martinez Rosales Ramirez Felix | $120,000 | None Available |
Source: Public Records
Mortgage History
| Date | Status | Borrower | Loan Amount |
|---|---|---|---|
| Previous Owner | Martinez Rosales Ramirez Felix | $107,020 |
Source: Public Records
Tax History
| Year | Tax Paid | Tax Assessment Tax Assessment Total Assessment is a certain percentage of the fair market value that is determined by local assessors to be the total taxable value of land and additions on the property. | Land | Improvement |
|---|---|---|---|---|
| 2025 | $2,628 | $177,000 | $29,800 | $147,200 |
| 2024 | $2,662 | $152,000 | $26,200 | $125,800 |
| 2023 | $2,662 | $148,500 | $22,700 | $125,800 |
| 2022 | $2,986 | $126,200 | $22,700 | $103,500 |
| 2021 | $3,102 | $122,400 | $18,900 | $103,500 |
| 2020 | $3,102 | $117,500 | $16,700 | $100,800 |
| 2019 | $3,020 | $106,300 | $16,700 | $89,600 |
Source: Public Records
Map
Nearby Homes
- 1426 3rd Ave SE
- 1704 Park Ave SE
- 1703 A Ave NE
- 8821 Zeppelin Ave NE
- 1720 2nd Ave SE
- 335 18th St SE
- 1608 B Ave NE
- 1551 C Ave NE
- 1442 4th Ave SE
- 1615 4th Ave SE
- 1900 Park Ave SE
- 1906 Park Ave SE
- 1269 4th Ave SE
- 1645 D Ave NE
- 371 19th St SE
- 1741 4th Ave SE
- 514 16th St NE
- 509 14th St SE
- 513 17th St SE
- 1800 5th Ave SE
- 1581 2nd Ave SE
- 213 16th St SE
- 1577 2nd Ave SE
- 1573 2nd Ave SE
- 217 16th St SE
- 1571 2nd Ave SE
- 1565 2nd Ave SE
- 1601 2nd Ave SE
- 1576 3rd Ave SE
- 214 16th St SE
- 1563 2nd Ave SE
- 216 16th St SE
- 1607 2nd Ave SE
- 1570 3rd Ave SE
- 115 16th St SE
- 208 Park Ct SE
- 1600 2nd Ave SE
- 204 Park Ct SE
- 212 Park Ct SE
- 1611 2nd Ave SE
Your Personal Tour Guide
Ask me questions while you tour the home.