Estimated Value: $749,622 - $880,000
3
Beds
2
Baths
1,607
Sq Ft
$520/Sq Ft
Est. Value
About This Home
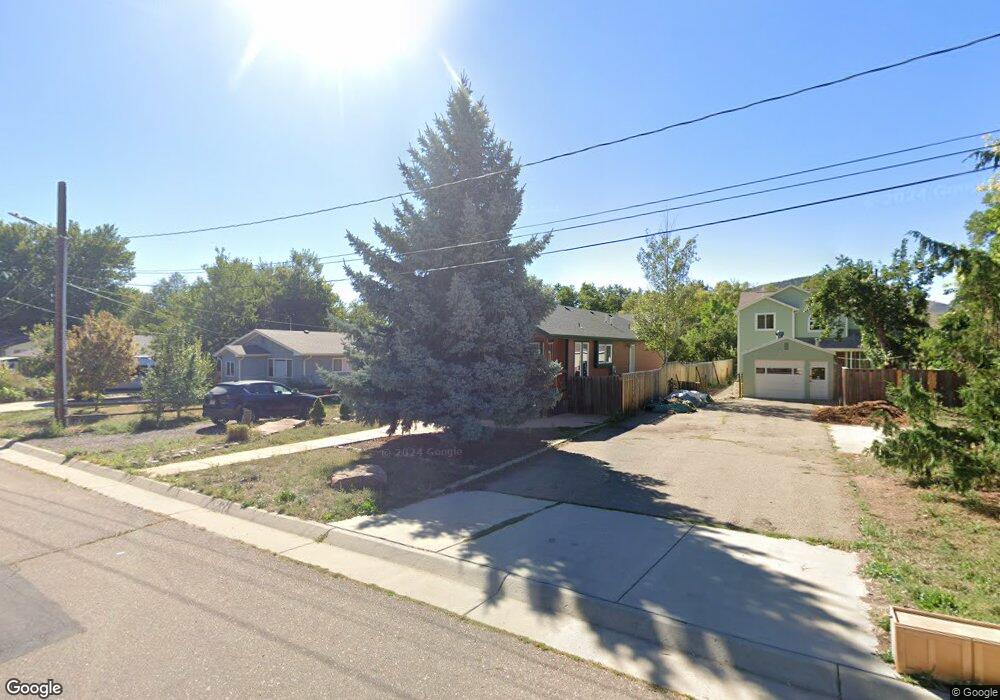
This home is located at 213 2nd Ave, Lyons, CO 80540 and is currently estimated at $835,406, approximately $519 per square foot. 213 2nd Ave is a home located in Boulder County with nearby schools including Lyons Elementary School and Lyons Middle/Senior High School.
Ownership History
Date
Name
Owned For
Owner Type
Purchase Details
Closed on
Aug 23, 2019
Sold by
Wise Carolyn and Bender Holly Wise
Bought by
Wise Carolyn and Reed Christopher
Current Estimated Value
Home Financials for this Owner
Home Financials are based on the most recent Mortgage that was taken out on this home.
Original Mortgage
$362,599
Outstanding Balance
$318,220
Interest Rate
3.8%
Mortgage Type
New Conventional
Estimated Equity
$517,186
Purchase Details
Closed on
Jun 20, 2019
Sold by
Judith S Wise Revocable Trust
Bought by
Wise Carolyn and Bender Holly Wise
Purchase Details
Closed on
Jul 22, 2016
Sold by
Wise Judith S
Bought by
Judith S Wise Revocable Rust
Purchase Details
Closed on
Aug 18, 1998
Sold by
Elsberry Dawn L and Elsberry Donald E
Bought by
Wise Judith S
Home Financials for this Owner
Home Financials are based on the most recent Mortgage that was taken out on this home.
Original Mortgage
$138,280
Interest Rate
6.9%
Create a Home Valuation Report for This Property
The Home Valuation Report is an in-depth analysis detailing your home's value as well as a comparison with similar homes in the area
Purchase History
| Date | Buyer | Sale Price | Title Company |
|---|---|---|---|
| Wise Carolyn | $238,500 | Ravenswood Title Company Llc | |
| Wise Carolyn | -- | None Available | |
| Judith S Wise Revocable Rust | -- | None Available | |
| Wise Judith S | $218,280 | -- |
Source: Public Records
Mortgage History
| Date | Status | Borrower | Loan Amount |
|---|---|---|---|
| Open | Wise Carolyn | $362,599 | |
| Previous Owner | Wise Judith S | $138,280 |
Source: Public Records
Tax History
| Year | Tax Paid | Tax Assessment Tax Assessment Total Assessment is a certain percentage of the fair market value that is determined by local assessors to be the total taxable value of land and additions on the property. | Land | Improvement |
|---|---|---|---|---|
| 2025 | $5,799 | $46,894 | $3,731 | $43,163 |
| 2024 | $5,799 | $46,894 | $3,731 | $43,163 |
| 2023 | $5,721 | $48,763 | $3,464 | $48,984 |
| 2022 | $4,817 | $39,073 | $3,169 | $35,904 |
| 2021 | $4,759 | $40,197 | $3,260 | $36,937 |
| 2020 | $4,087 | $34,206 | $8,294 | $25,912 |
| 2019 | $4,006 | $34,206 | $8,294 | $25,912 |
| 2018 | $3,482 | $30,326 | $8,352 | $21,974 |
| 2017 | $3,425 | $33,528 | $9,234 | $24,294 |
| 2016 | $2,979 | $22,758 | $6,448 | $16,310 |
| 2015 | $2,510 | $18,579 | $2,802 | $15,777 |
| 2014 | $2,791 | $26,929 | $4,060 | $22,869 |
Source: Public Records
Map
Nearby Homes
- 342 4th Ave
- 618 Overlook Dr
- 17667 Route 7
- 18673 Route 7
- 104 Noland Ct
- 350 Mcconnell Dr
- 121 Osprey Ln
- 430 Carter Dr
- 125 Longs Peak Dr
- 1040 5th Ave 2 and 4
- 1040 5th Ave 5
- 0 Apple Valley Rd
- 223 Stone Canyon Rd
- 1117 5th Ave
- 1117 N 5th Ave
- 119 Eagle Canyon Cir
- 2615 Eagle Ridge Rd
- 2685 Eagle Ridge Rd
- 1285 Eagle Ridge Rd
- 3001 Eagle Ridge Rd
Your Personal Tour Guide
Ask me questions while you tour the home.