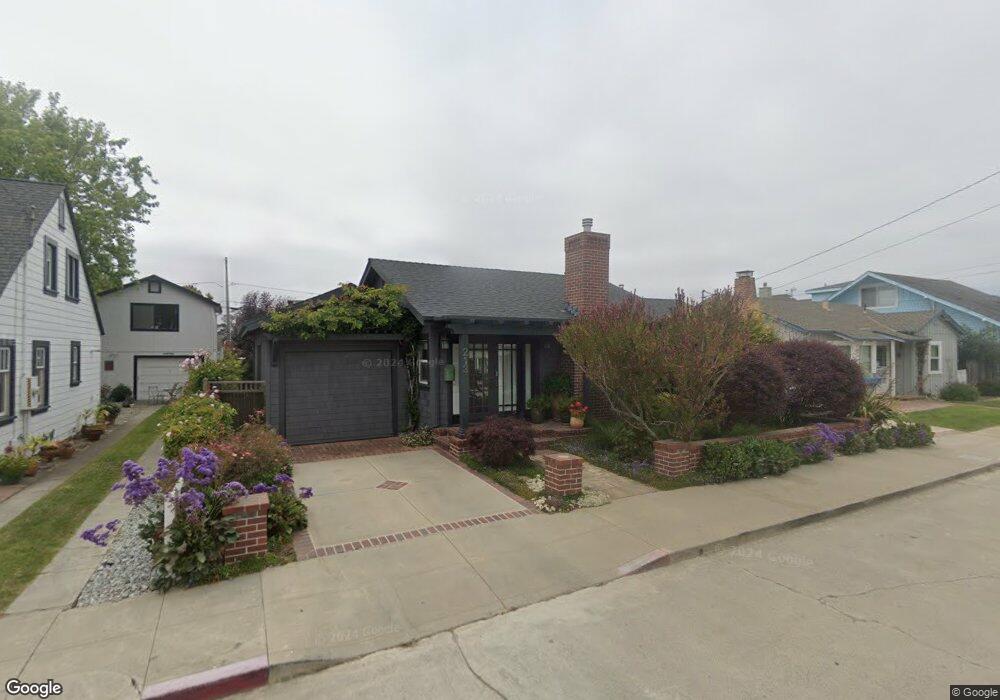
213 2nd Ave Santa Cruz, CA 95062
Lower Seabright NeighborhoodEstimated Value: $1,308,028 - $1,446,000
2
Beds
1
Bath
998
Sq Ft
$1,366/Sq Ft
Est. Value
About This Home
This home is located at 213 2nd Ave, Santa Cruz, CA 95062 and is currently estimated at $1,363,257, approximately $1,365 per square foot. 213 2nd Ave is a home located in Santa Cruz County with nearby schools including Gault Elementary School, Mission Hill Middle School, and Santa Cruz High School.
Ownership History
Date
Name
Owned For
Owner Type
Purchase Details
Closed on
Dec 4, 2018
Sold by
Laughlin Peggy M O
Bought by
Laughlin Peggy O and The O Laughlin Trust
Current Estimated Value
Purchase Details
Closed on
Feb 24, 1999
Sold by
Schmidt Warren P and Schmidt Jean D
Bought by
Olaughlin Peggy M
Home Financials for this Owner
Home Financials are based on the most recent Mortgage that was taken out on this home.
Original Mortgage
$300,000
Outstanding Balance
$72,668
Interest Rate
6.76%
Estimated Equity
$1,290,589
Purchase Details
Closed on
Jan 18, 1999
Sold by
Schmidt Warren P
Bought by
Schmidt Warren P and Schmidt Jean D
Home Financials for this Owner
Home Financials are based on the most recent Mortgage that was taken out on this home.
Original Mortgage
$300,000
Outstanding Balance
$72,668
Interest Rate
6.76%
Estimated Equity
$1,290,589
Purchase Details
Closed on
Jan 5, 1998
Sold by
Godsil Adelita J and Godsil Warren P
Bought by
Godsil Adelita Jones and Godsil Adelita Jones
Create a Home Valuation Report for This Property
The Home Valuation Report is an in-depth analysis detailing your home's value as well as a comparison with similar homes in the area
Home Values in the Area
Average Home Value in this Area
Purchase History
| Date | Buyer | Sale Price | Title Company |
|---|---|---|---|
| Laughlin Peggy O | -- | None Available | |
| Olaughlin Peggy M | $415,000 | First American Title Co | |
| Schmidt Warren P | -- | -- | |
| Schmidt Warren P | -- | -- | |
| Godsil Adelita Jones | -- | -- |
Source: Public Records
Mortgage History
| Date | Status | Borrower | Loan Amount |
|---|---|---|---|
| Open | Olaughlin Peggy M | $300,000 |
Source: Public Records
Tax History Compared to Growth
Tax History
| Year | Tax Paid | Tax Assessment Tax Assessment Total Assessment is a certain percentage of the fair market value that is determined by local assessors to be the total taxable value of land and additions on the property. | Land | Improvement |
|---|---|---|---|---|
| 2025 | $7,898 | $699,499 | $572,222 | $127,277 |
| 2023 | $7,803 | $672,337 | $550,002 | $122,335 |
| 2022 | $7,717 | $659,154 | $539,218 | $119,936 |
| 2021 | $7,558 | $646,230 | $528,645 | $117,585 |
| 2020 | $7,394 | $629,992 | $523,224 | $106,768 |
| 2019 | $7,032 | $599,698 | $512,965 | $86,733 |
| 2018 | $6,954 | $587,940 | $502,907 | $85,033 |
| 2017 | $6,866 | $576,413 | $493,046 | $83,367 |
| 2016 | $6,491 | $565,110 | $483,378 | $81,732 |
| 2015 | $6,314 | $556,621 | $476,117 | $80,504 |
| 2014 | $6,209 | $545,718 | $466,791 | $78,927 |
Source: Public Records
Map
Nearby Homes
- 211 2nd Ave
- 207 2nd Ave
- 220 Atlantic Ave Unit 310
- 220 Atlantic Ave Unit 204
- 1703 E Cliff Dr
- 407 Seabright Ave
- 92 Frederick St Unit A
- 360 5th Ave
- 152 Frederick St
- 130 Darwin St
- 1122 Seabright Ave
- 2900 E Cliff Dr
- 2974 E Cliff Dr
- 304 Harbor Dr
- 21130 E Cliff Dr
- 1221 Broadway Unit 2
- 311 Ocean St
- 315 Ocean St
- 419 Barson St
- 205 Roosevelt Terrace