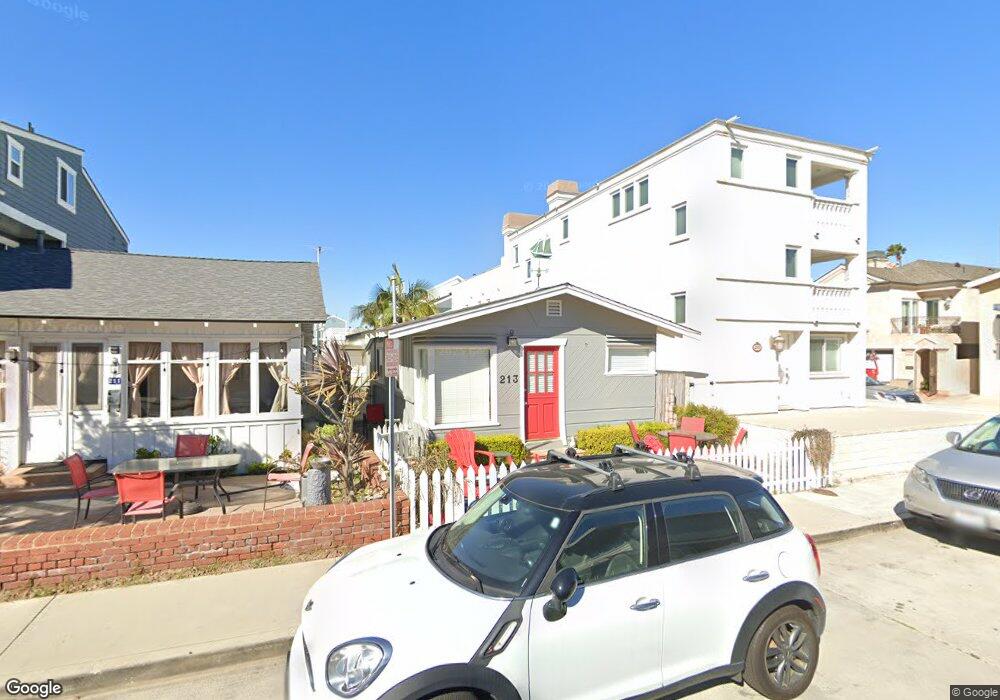
213 38th St Newport Beach, CA 92663
West Newport Beach NeighborhoodEstimated Value: $1,607,000 - $2,531,000
2
Beds
1
Bath
488
Sq Ft
$4,269/Sq Ft
Est. Value
About This Home
This home is located at 213 38th St, Newport Beach, CA 92663 and is currently estimated at $2,083,219, approximately $4,268 per square foot. 213 38th St is a home located in Orange County with nearby schools including Newport Elementary School, Horace Ensign Intermediate School, and Newport Harbor High School.
Ownership History
Date
Name
Owned For
Owner Type
Purchase Details
Closed on
Jun 2, 2021
Sold by
Heide William J and Heide Linda T
Bought by
Heide Linda T and Heide William J
Current Estimated Value
Purchase Details
Closed on
Aug 21, 1996
Sold by
Mosqueira Eloise
Bought by
Heide William J and Heide Linda T
Home Financials for this Owner
Home Financials are based on the most recent Mortgage that was taken out on this home.
Original Mortgage
$174,000
Interest Rate
8.37%
Purchase Details
Closed on
Jan 19, 1996
Sold by
Jeanne Haas
Bought by
Mosqueira Eloise
Purchase Details
Closed on
Sep 29, 1994
Sold by
Mosquiera Eloise
Bought by
Haas Jeanne Stockton
Home Financials for this Owner
Home Financials are based on the most recent Mortgage that was taken out on this home.
Original Mortgage
$225,000
Interest Rate
8.7%
Mortgage Type
Seller Take Back
Purchase Details
Closed on
Mar 3, 1993
Sold by
Lasater Cliff and Lasater Linda
Bought by
Mosqueira Eloise
Create a Home Valuation Report for This Property
The Home Valuation Report is an in-depth analysis detailing your home's value as well as a comparison with similar homes in the area
Home Values in the Area
Average Home Value in this Area
Purchase History
| Date | Buyer | Sale Price | Title Company |
|---|---|---|---|
| Heide Linda T | -- | None Available | |
| Heide William J | $212,500 | Fidelity National Title | |
| Mosqueira Eloise | -- | Fidelity National Title Ins | |
| Haas Jeanne Stockton | $235,000 | -- | |
| Mosqueira Eloise | $240,000 | Continental Lawyers Title Co |
Source: Public Records
Mortgage History
| Date | Status | Borrower | Loan Amount |
|---|---|---|---|
| Previous Owner | Heide William J | $174,000 | |
| Previous Owner | Haas Jeanne Stockton | $225,000 |
Source: Public Records
Tax History Compared to Growth
Tax History
| Year | Tax Paid | Tax Assessment Tax Assessment Total Assessment is a certain percentage of the fair market value that is determined by local assessors to be the total taxable value of land and additions on the property. | Land | Improvement |
|---|---|---|---|---|
| 2025 | $5,360 | $351,315 | $335,856 | $15,459 |
| 2024 | $5,360 | $344,427 | $329,271 | $15,156 |
| 2023 | $5,277 | $337,674 | $322,815 | $14,859 |
| 2022 | $5,152 | $331,053 | $316,485 | $14,568 |
| 2021 | $5,092 | $324,562 | $310,279 | $14,283 |
| 2020 | $5,072 | $321,235 | $307,098 | $14,137 |
| 2019 | $5,015 | $314,937 | $301,077 | $13,860 |
| 2018 | $3,601 | $308,762 | $295,173 | $13,589 |
| 2017 | $3,538 | $302,708 | $289,385 | $13,323 |
| 2016 | $3,462 | $296,773 | $283,711 | $13,062 |
| 2015 | $3,427 | $292,316 | $279,450 | $12,866 |
| 2014 | $3,348 | $286,590 | $273,976 | $12,614 |
Source: Public Records
Map
Nearby Homes
- 3709 W Balboa Blvd
- 207 40th St Unit 2
- 207 40th St
- 213 41st St
- 4106 River Ave Unit Share 2
- 4106 River Ave
- 3810 Channel Place
- 4208 River Ave
- 20 Balboa Coves
- 519 35th St Unit 1
- 4405 Channel Place
- 506 Clubhouse Ave
- 410 Clubhouse Ave
- 613 36th St
- 219 32nd St
- 215 32nd St
- 126 31st St
- 106 31st St
- 126 47th St Unit 1
- 112 30th St