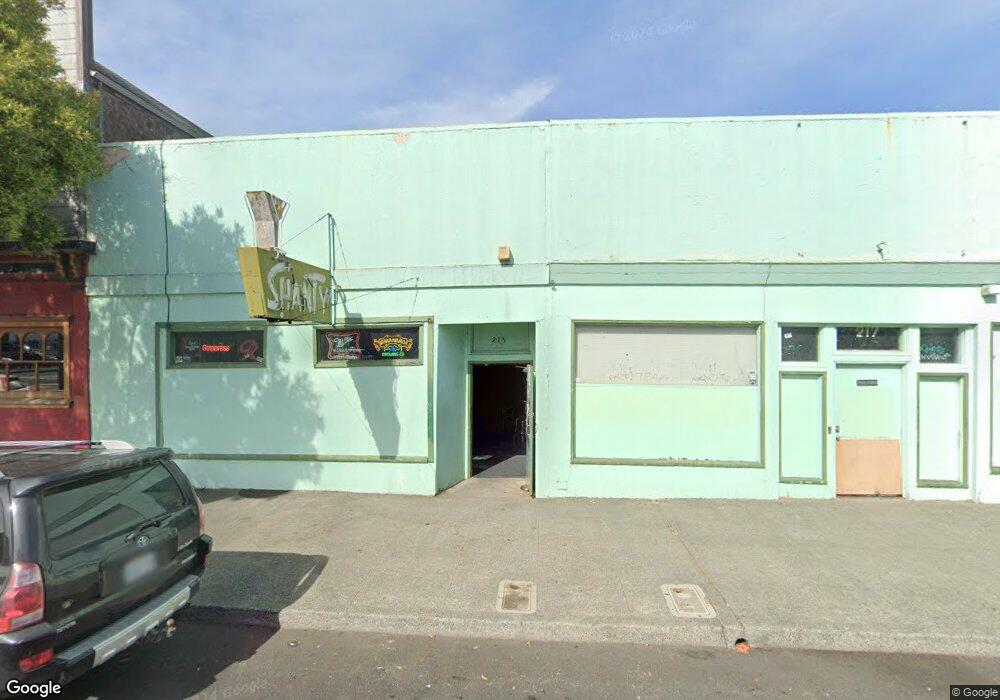
213 3rd St Eureka, CA 95501
Estimated Value: $956,159
Studio
2
Baths
4,657
Sq Ft
$205/Sq Ft
Est. Value
About This Home
This home is located at 213 3rd St, Eureka, CA 95501 and is currently estimated at $956,159, approximately $205 per square foot. 213 3rd St is a home located in Humboldt County with nearby schools including Lafayette Elementary School, Catherine L. Zane Middle School, and Eureka Senior High School.
Ownership History
Date
Name
Owned For
Owner Type
Purchase Details
Closed on
Mar 31, 2021
Sold by
Sandstrom Lynne Elaine and Lynne Elaine Sandstrom Living Trust
Bought by
Lynne Elaine Sandstrom Living Trust and Sandstrom
Current Estimated Value
Home Financials for this Owner
Home Financials are based on the most recent Mortgage that was taken out on this home.
Original Mortgage
$340,000
Outstanding Balance
$303,899
Interest Rate
3.05%
Mortgage Type
Credit Line Revolving
Estimated Equity
$652,260
Purchase Details
Closed on
Mar 26, 2021
Sold by
Sandstrom Lynne Elaine and Lynne Elaine Sandstrom Living
Bought by
Sandstrom Lynne Elaine and Lynne Elaine Sandstrom Living
Home Financials for this Owner
Home Financials are based on the most recent Mortgage that was taken out on this home.
Original Mortgage
$340,000
Outstanding Balance
$303,899
Interest Rate
3.05%
Mortgage Type
Credit Line Revolving
Estimated Equity
$652,260
Purchase Details
Closed on
Mar 26, 2020
Sold by
Burton Ariane
Bought by
Lynne Elaine Sandstrom Living Trust and Sandstrom
Purchase Details
Closed on
Nov 22, 2011
Sold by
1998 Delgrande Virginia A and 1998 Virginia A Del Grande
Bought by
Sandstrom Lynne E and Krueger Rana
Home Financials for this Owner
Home Financials are based on the most recent Mortgage that was taken out on this home.
Original Mortgage
$315,000
Interest Rate
4.06%
Mortgage Type
Seller Take Back
Purchase Details
Closed on
Mar 6, 1998
Sold by
Delgrande Virginia A
Bought by
Delgrande Virginia A and The Virginia A Delgrande 1998
Create a Home Valuation Report for This Property
The Home Valuation Report is an in-depth analysis detailing your home's value as well as a comparison with similar homes in the area
Purchase History
| Date | Buyer | Sale Price | Title Company |
|---|---|---|---|
| Lynne Elaine Sandstrom Living Trust | -- | Orange Coast Title | |
| Sandstrom Lynne Elaine | -- | Orange Coast Title Company | |
| Lynne Elaine Sandstrom Living Trust | $524,545 | Sandstrom Lynne | |
| Sandstrom Lynne E | $350,000 | Humboldt Land Title Company | |
| Delgrande Virginia A | -- | -- |
Source: Public Records
Mortgage History
| Date | Status | Borrower | Loan Amount |
|---|---|---|---|
| Open | Lynne Elaine Sandstrom Living Trust | $340,000 | |
| Previous Owner | Sandstrom Lynne E | $315,000 |
Source: Public Records
Tax History
| Year | Tax Paid | Tax Assessment Tax Assessment Total Assessment is a certain percentage of the fair market value that is determined by local assessors to be the total taxable value of land and additions on the property. | Land | Improvement |
|---|---|---|---|---|
| 2025 | $4,498 | $437,395 | $225,225 | $212,170 |
| 2024 | $4,498 | $428,819 | $220,809 | $208,010 |
| 2023 | $4,435 | $420,412 | $216,480 | $203,932 |
| 2022 | $4,604 | $412,170 | $212,236 | $199,934 |
| 2021 | $4,312 | $404,089 | $208,075 | $196,014 |
| 2020 | $4,301 | $401,969 | $229,698 | $172,271 |
| 2019 | $4,213 | $394,089 | $225,195 | $168,894 |
| 2018 | $4,150 | $386,363 | $220,780 | $165,583 |
| 2017 | $4,129 | $378,788 | $216,451 | $162,337 |
| 2016 | $4,130 | $371,361 | $212,207 | $159,154 |
| 2015 | $4,093 | $365,784 | $209,020 | $156,764 |
| 2014 | $3,826 | $358,620 | $204,926 | $153,694 |
Source: Public Records
Map
Nearby Homes
Your Personal Tour Guide
Ask me questions while you tour the home.