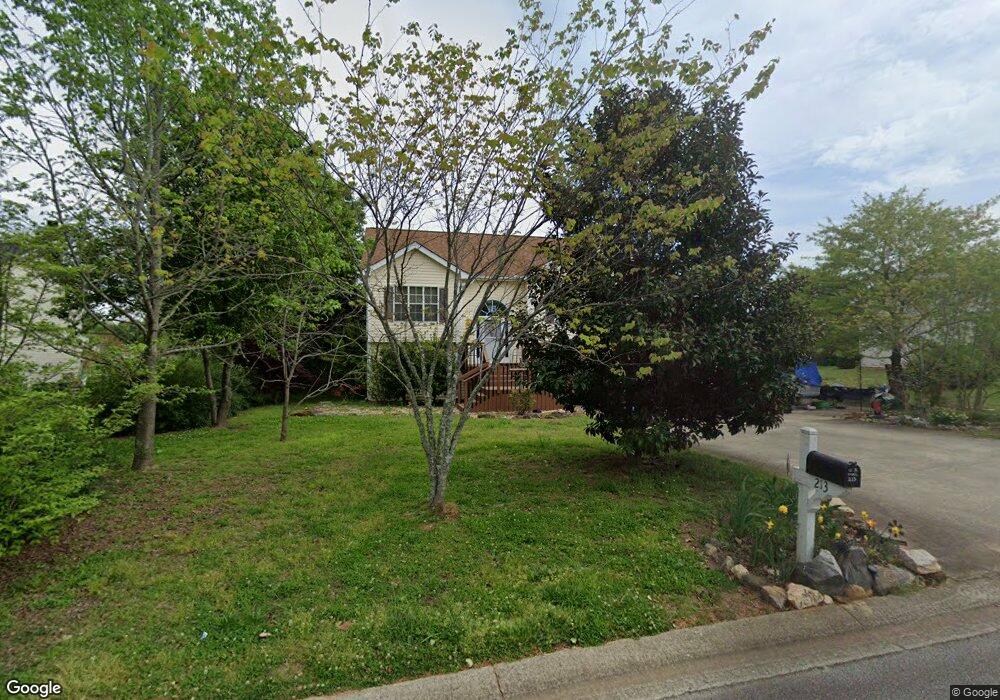
213 Angie Way Unit 2 Bethlehem, GA 30620
Estimated Value: $363,050 - $399,000
3
Beds
2
Baths
2,670
Sq Ft
$142/Sq Ft
Est. Value
About This Home
This home is located at 213 Angie Way Unit 2, Bethlehem, GA 30620 and is currently estimated at $380,013, approximately $142 per square foot. 213 Angie Way Unit 2 is a home located in Barrow County with nearby schools including Yargo Elementary School, Haymon-Morris Middle School, and Apalachee High School.
Ownership History
Date
Name
Owned For
Owner Type
Purchase Details
Closed on
Jun 14, 2002
Sold by
Thurmond Jerry S
Bought by
Allen William and Allen Teresa
Current Estimated Value
Home Financials for this Owner
Home Financials are based on the most recent Mortgage that was taken out on this home.
Original Mortgage
$132,000
Outstanding Balance
$55,655
Interest Rate
6.77%
Mortgage Type
New Conventional
Estimated Equity
$324,358
Purchase Details
Closed on
Dec 10, 1998
Sold by
Brenda Stancil Real Estate
Bought by
Thurmond Jerry S
Home Financials for this Owner
Home Financials are based on the most recent Mortgage that was taken out on this home.
Original Mortgage
$122,842
Interest Rate
6.84%
Mortgage Type
New Conventional
Purchase Details
Closed on
Jan 22, 1998
Sold by
C G S Development In
Bought by
Brenda Stancil Real
Purchase Details
Closed on
Jul 9, 1996
Bought by
C G S Development In
Create a Home Valuation Report for This Property
The Home Valuation Report is an in-depth analysis detailing your home's value as well as a comparison with similar homes in the area
Home Values in the Area
Average Home Value in this Area
Purchase History
| Date | Buyer | Sale Price | Title Company |
|---|---|---|---|
| Allen William | $132,000 | -- | |
| Thurmond Jerry S | $119,500 | -- | |
| Thurmond Jerry S | $119,500 | -- | |
| Brenda Stancil Real | $38,000 | -- | |
| C G S Development In | -- | -- |
Source: Public Records
Mortgage History
| Date | Status | Borrower | Loan Amount |
|---|---|---|---|
| Open | Allen William | $132,000 | |
| Previous Owner | Thurmond Jerry S | $122,842 |
Source: Public Records
Tax History Compared to Growth
Tax History
| Year | Tax Paid | Tax Assessment Tax Assessment Total Assessment is a certain percentage of the fair market value that is determined by local assessors to be the total taxable value of land and additions on the property. | Land | Improvement |
|---|---|---|---|---|
| 2024 | $2,855 | $130,220 | $26,800 | $103,420 |
| 2023 | $3,254 | $130,620 | $26,800 | $103,820 |
| 2022 | $2,823 | $110,870 | $22,400 | $88,470 |
| 2021 | $2,801 | $104,470 | $16,000 | $88,470 |
| 2020 | $2,338 | $84,902 | $16,000 | $68,902 |
| 2019 | $2,373 | $84,902 | $16,000 | $68,902 |
| 2018 | $2,273 | $82,102 | $13,200 | $68,902 |
| 2017 | $2,124 | $72,935 | $13,200 | $59,735 |
| 2016 | $1,584 | $55,815 | $13,200 | $42,615 |
| 2015 | $1,442 | $49,781 | $13,200 | $36,581 |
| 2014 | $1,263 | $43,467 | $6,468 | $36,999 |
| 2013 | -- | $40,785 | $6,468 | $34,317 |
Source: Public Records
Map
Nearby Homes
- 209 Angie Way
- 303 Ron Dr
- 1111 Otis Dr
- 1129 Loganville Hwy
- 1024 Lyndhurst Ln
- 1164 Otis Dr
- 758 Clarence Edwards Rd
- 738 Worth Ct
- 720 Westbury Ct
- 0 Jb Owens Unit 7552902
- 0 Jb Owens Unit 7552891
- 0 Jb Owens Unit LOT 2 - 2.09 ACRES
- 0 Jb Owens Unit LOT 3 - 2.01 ACRES
- 724 Westbury Dr
- 704 Newnham Walk
- The Barnes Plan at River Meadows
- The Paisley Plan at River Meadows
- The Rose II Plan at River Meadows
- The Logan Plan at River Meadows
- 190 Lokeys Ln
- 215 Angie Way
- 211 Angie Way Unit 2
- 217 Angie Way
- 217 Angie Way Unit 1
- 157 Cole Cir Unit 1
- 161 Cole Cir Unit 1
- 212 Angie Way
- 0 Angie Way
- 214 Angie Way
- 210 Angie Way
- 210 Angie Way Unit 2
- 163 Cole Cir Unit 1
- 776 Bethel Bower Rd
- 207 Angie Way
- 219 Angie Way Unit 2
- 208 Angie Way Unit 2
- 216 Angie Way Unit 2
- 216 Angie Way
- 165 Cole Cir
- 206 Angie Way