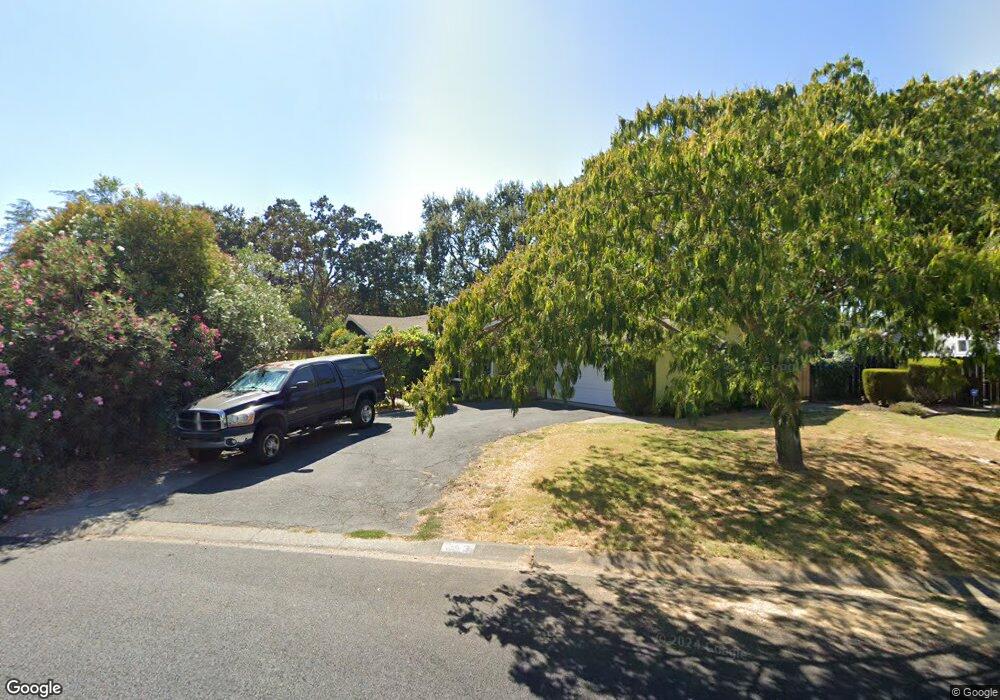
213 Apollo Way Pleasant Hill, CA 94523
Estimated Value: $1,126,000 - $1,288,168
3
Beds
2
Baths
1,686
Sq Ft
$718/Sq Ft
Est. Value
About This Home
This home is located at 213 Apollo Way, Pleasant Hill, CA 94523 and is currently estimated at $1,210,292, approximately $717 per square foot. 213 Apollo Way is a home located in Contra Costa County with nearby schools including Strandwood Elementary School, Pleasant Hill Middle School, and College Park High School.
Ownership History
Date
Name
Owned For
Owner Type
Purchase Details
Closed on
Apr 8, 2013
Sold by
Willett Sean and Meneken Willett Joscelyn
Bought by
Willett Sean and Meneken Willett Joscelyn
Current Estimated Value
Home Financials for this Owner
Home Financials are based on the most recent Mortgage that was taken out on this home.
Original Mortgage
$392,353
Outstanding Balance
$278,572
Interest Rate
3.6%
Mortgage Type
FHA
Estimated Equity
$931,720
Purchase Details
Closed on
Jun 30, 2011
Sold by
Milliken Ann M and Flynn Debra Ann
Bought by
Willett Sean and Meneken Joscelyn
Home Financials for this Owner
Home Financials are based on the most recent Mortgage that was taken out on this home.
Original Mortgage
$402,982
Interest Rate
4.45%
Mortgage Type
FHA
Purchase Details
Closed on
Jan 4, 2010
Sold by
Milliken Ann M
Bought by
Milliken Ann M and Flynn Debra Ann
Create a Home Valuation Report for This Property
The Home Valuation Report is an in-depth analysis detailing your home's value as well as a comparison with similar homes in the area
Home Values in the Area
Average Home Value in this Area
Purchase History
| Date | Buyer | Sale Price | Title Company |
|---|---|---|---|
| Willett Sean | -- | Ticor Title Company Of Ca | |
| Willett Sean | $376,000 | Chicago Title Company | |
| Milliken Ann M | -- | None Available | |
| Milliken Ann M | -- | None Available |
Source: Public Records
Mortgage History
| Date | Status | Borrower | Loan Amount |
|---|---|---|---|
| Open | Willett Sean | $392,353 | |
| Closed | Willett Sean | $402,982 |
Source: Public Records
Tax History Compared to Growth
Tax History
| Year | Tax Paid | Tax Assessment Tax Assessment Total Assessment is a certain percentage of the fair market value that is determined by local assessors to be the total taxable value of land and additions on the property. | Land | Improvement |
|---|---|---|---|---|
| 2025 | $7,339 | $597,110 | $345,408 | $251,702 |
| 2024 | $6,880 | $585,403 | $338,636 | $246,767 |
| 2023 | $6,880 | $543,926 | $331,997 | $211,929 |
| 2022 | $5,823 | $445,027 | $325,488 | $119,539 |
| 2021 | $5,693 | $436,302 | $319,106 | $117,196 |
| 2019 | $5,559 | $423,363 | $309,642 | $113,721 |
| 2018 | $5,363 | $415,063 | $303,571 | $111,492 |
| 2017 | $5,196 | $406,925 | $297,619 | $109,306 |
| 2016 | $5,067 | $398,947 | $291,784 | $107,163 |
| 2015 | $5,021 | $392,956 | $287,402 | $105,554 |
| 2014 | $4,951 | $385,260 | $281,773 | $103,487 |
Source: Public Records
Map
Nearby Homes
- 309 Sunset Rd
- 589 Maureen Ln
- 2422 Pleasant Hill Rd Unit 6
- 5 Harwich Walk Unit 55
- 576 Best Rd
- 1919 Helen Rd Unit 2
- 368 Grapevine Place
- 58 Ramsgate Ln
- 2951 Hannan Dr
- 220 Devonshire Ct
- 505 Tananger Heights Ct
- 900 Kimberly Cir
- 808 Grayson Rd
- 25 Brandon Rd
- 117 Haven Cir
- 616 Aleta Place
- 277 Gloria Dr
- 2162 Orin Ln
- 249 Golf Links St
- 1772 Ruth Dr