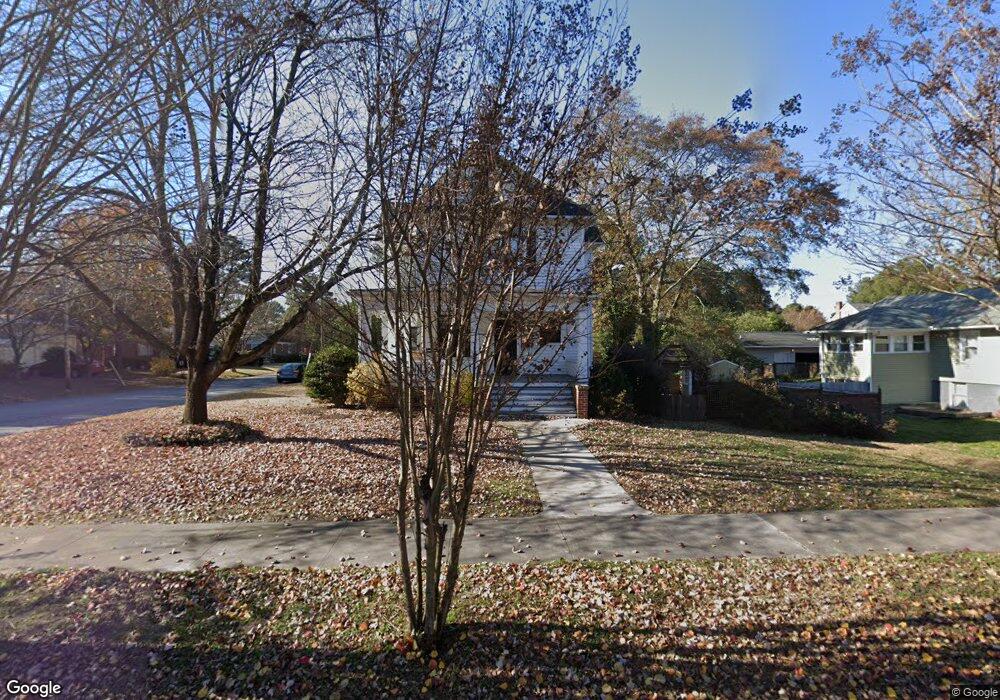
213 Bosley Ave Suffolk, VA 23434
Holy Neck NeighborhoodEstimated Value: $346,477 - $481,000
4
Beds
3
Baths
3,081
Sq Ft
$130/Sq Ft
Est. Value
About This Home
This home is located at 213 Bosley Ave, Suffolk, VA 23434 and is currently estimated at $400,619, approximately $130 per square foot. 213 Bosley Ave is a home located in Suffolk City with nearby schools including Elephant's Fork Elementary School, King's Fork Middle School, and King's Fork High School.
Ownership History
Date
Name
Owned For
Owner Type
Purchase Details
Closed on
May 20, 2019
Sold by
Alphin Dorothy B and Pasquine Allison
Bought by
Blehm Jagger and Blehm Samantha C
Current Estimated Value
Home Financials for this Owner
Home Financials are based on the most recent Mortgage that was taken out on this home.
Original Mortgage
$294,467
Outstanding Balance
$258,370
Interest Rate
4.1%
Mortgage Type
FHA
Estimated Equity
$142,249
Purchase Details
Closed on
Aug 30, 2018
Sold by
Professional Foreclosure Corporation Of
Bought by
Pasquine Allison and Alphin Dorothy B
Purchase Details
Closed on
Feb 19, 2010
Sold by
Simple Real Estate Solutions
Bought by
Blankenship Daniel R
Home Financials for this Owner
Home Financials are based on the most recent Mortgage that was taken out on this home.
Original Mortgage
$196,638
Interest Rate
5.17%
Mortgage Type
VA
Create a Home Valuation Report for This Property
The Home Valuation Report is an in-depth analysis detailing your home's value as well as a comparison with similar homes in the area
Home Values in the Area
Average Home Value in this Area
Purchase History
| Date | Buyer | Sale Price | Title Company |
|---|---|---|---|
| Blehm Jagger | $299,900 | Attorney | |
| Pasquine Allison | $71,000 | None Available | |
| Blankenship Daniel R | $192,500 | -- | |
| Simple Real Estate Solutions | $173,234 | -- |
Source: Public Records
Mortgage History
| Date | Status | Borrower | Loan Amount |
|---|---|---|---|
| Open | Blehm Jagger | $294,467 | |
| Previous Owner | Simple Real Estate Solutions | $196,638 |
Source: Public Records
Tax History Compared to Growth
Tax History
| Year | Tax Paid | Tax Assessment Tax Assessment Total Assessment is a certain percentage of the fair market value that is determined by local assessors to be the total taxable value of land and additions on the property. | Land | Improvement |
|---|---|---|---|---|
| 2024 | $3,647 | $290,100 | $68,700 | $221,400 |
| 2023 | $3,497 | $274,100 | $68,700 | $205,400 |
| 2022 | $2,726 | $250,100 | $62,500 | $187,600 |
| 2021 | $2,547 | $229,500 | $50,000 | $179,500 |
| 2020 | $2,309 | $208,000 | $50,000 | $158,000 |
| 2019 | $2,309 | $208,000 | $50,000 | $158,000 |
| 2018 | $2,354 | $200,100 | $50,000 | $150,100 |
| 2017 | $2,141 | $200,100 | $50,000 | $150,100 |
| 2016 | $2,141 | $200,100 | $50,000 | $150,100 |
| 2015 | $1,141 | $207,200 | $50,000 | $157,200 |
| 2014 | $1,141 | $207,200 | $50,000 | $157,200 |
Source: Public Records
Map
Nearby Homes
- 708 Maryland Ave
- 205 Bosley Ave
- 211 S Broad St
- 921 Howard Place
- 118 S Broad St
- 309 Linden Ave
- 117 Park Rd
- 916 Delaware Ave
- 308 Linden Ave
- 314 Linden Ave
- 203 Saint James Ave
- 313 Saint James Ave
- 1013 Virginia Ave
- 212 Saint James Ave
- 312 Saint James Ave
- 118 Saint James Ave
- 406 Saint James Ave
- 707 Ashley Ave
- 717 Ashley Ave
- 207 Pitchkettle Rd
- 209 Bosley Ave
- 706 Maryland Ave
- 301 Bosley Ave
- 207 Bosley Ave
- 705 Maryland Ave
- 206 Causey Ave
- 206 Causey Ave
- 212 Bosley Ave
- 210 Bosley Ave
- 300 Causey Ave
- 605 Maryland Ave
- 305 Bosley Ave
- 202 Causey Ave
- 208 Bosley Ave
- 304 Causey Ave
- 206 Bosley Ave
- 304 Bosley Ave
- 204 Bosley Ave
- 201 Bosley Ave
- 306 Bosley Ave