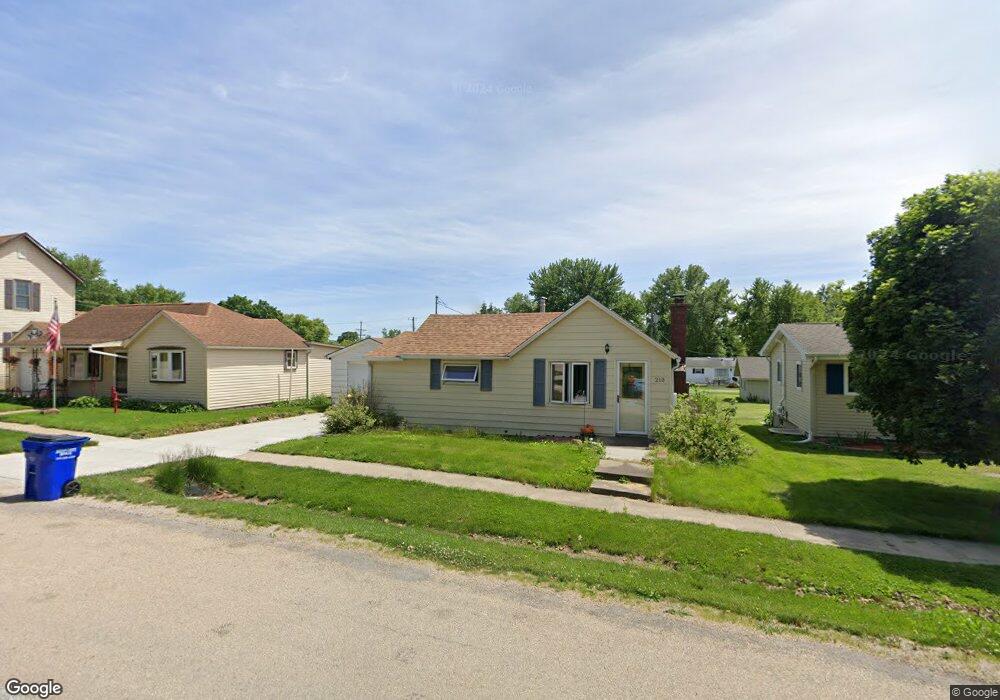
213 Center St Oxford, IA 52322
Estimated Value: $115,000 - $150,000
2
Beds
2
Baths
901
Sq Ft
$156/Sq Ft
Est. Value
About This Home
This home is located at 213 Center St, Oxford, IA 52322 and is currently estimated at $140,986, approximately $156 per square foot. 213 Center St is a home located in Johnson County with nearby schools including Clear Creek Amana High School.
Ownership History
Date
Name
Owned For
Owner Type
Purchase Details
Closed on
Oct 8, 2025
Sold by
Stellinga Mark and Stellinga Connie
Bought by
Pitlick Kyle J
Current Estimated Value
Home Financials for this Owner
Home Financials are based on the most recent Mortgage that was taken out on this home.
Original Mortgage
$34,600
Outstanding Balance
$34,600
Interest Rate
6.35%
Mortgage Type
New Conventional
Estimated Equity
$106,386
Purchase Details
Closed on
Sep 19, 2025
Sold by
Schwarting Kelsey
Bought by
Stellinga Mark and Stellinga Connie
Home Financials for this Owner
Home Financials are based on the most recent Mortgage that was taken out on this home.
Original Mortgage
$34,600
Outstanding Balance
$34,600
Interest Rate
6.35%
Mortgage Type
New Conventional
Estimated Equity
$106,386
Purchase Details
Closed on
Oct 28, 2021
Sold by
Rocha Meggan Riggan and Riggan L M
Bought by
Schwarting Kelsey
Home Financials for this Owner
Home Financials are based on the most recent Mortgage that was taken out on this home.
Original Mortgage
$120,000
Interest Rate
2.88%
Mortgage Type
Purchase Money Mortgage
Create a Home Valuation Report for This Property
The Home Valuation Report is an in-depth analysis detailing your home's value as well as a comparison with similar homes in the area
Home Values in the Area
Average Home Value in this Area
Purchase History
| Date | Buyer | Sale Price | Title Company |
|---|---|---|---|
| Pitlick Kyle J | $173,000 | None Listed On Document | |
| Stellinga Mark | -- | None Listed On Document | |
| Schwarting Kelsey | $100,000 | None Available |
Source: Public Records
Mortgage History
| Date | Status | Borrower | Loan Amount |
|---|---|---|---|
| Open | Pitlick Kyle J | $34,600 | |
| Open | Pitlick Kyle J | $138,400 | |
| Previous Owner | Schwarting Kelsey | $120,000 |
Source: Public Records
Tax History Compared to Growth
Tax History
| Year | Tax Paid | Tax Assessment Tax Assessment Total Assessment is a certain percentage of the fair market value that is determined by local assessors to be the total taxable value of land and additions on the property. | Land | Improvement |
|---|---|---|---|---|
| 2025 | $2,204 | $113,000 | $31,500 | $81,500 |
| 2024 | $2,134 | $110,200 | $31,500 | $78,700 |
| 2023 | $2,012 | $110,200 | $31,500 | $78,700 |
| 2022 | $1,662 | $90,600 | $22,500 | $68,100 |
| 2021 | $1,664 | $90,600 | $22,500 | $68,100 |
| 2020 | $1,664 | $87,900 | $19,800 | $68,100 |
| 2019 | $1,474 | $87,900 | $19,800 | $68,100 |
| 2018 | $1,588 | $80,700 | $0 | $0 |
| 2017 | $1,470 | $82,000 | $19,800 | $62,200 |
| 2016 | $1,408 | $81,700 | $19,800 | $61,900 |
| 2015 | $1,408 | $81,700 | $19,800 | $61,900 |
| 2014 | $1,234 | $72,200 | $19,800 | $52,400 |
Source: Public Records
Map
Nearby Homes
- 230 W Main St
- 313 James Blvd
- 401 James Blvd
- Lot 1 Wildflower Estates Part One
- 571 N Kimberlite St
- 3141 Lincolns Ln NW
- Lot 6 (Tbd) Lincolns Landing
- Lot 3 (Tbd) Lincolns Landing
- 2442 Copi Rd NW
- 3375 Half Moon Ave SW
- 46 Renee Ln
- 1300 Tall Grass Ave
- 1337 Twin Leaf Ave
- 510 Elizabeth Ln
- 1250 Tall Grass Ave
- 1336 Moon Flower Ave
- 607 Owen St
- Lot #3 Leighton Ln
- Lot #4 Leighton Ln
- Lot #1 Leighton Ln