Estimated Value: $314,719 - $350,000
3
Beds
2
Baths
1,866
Sq Ft
$176/Sq Ft
Est. Value
About This Home
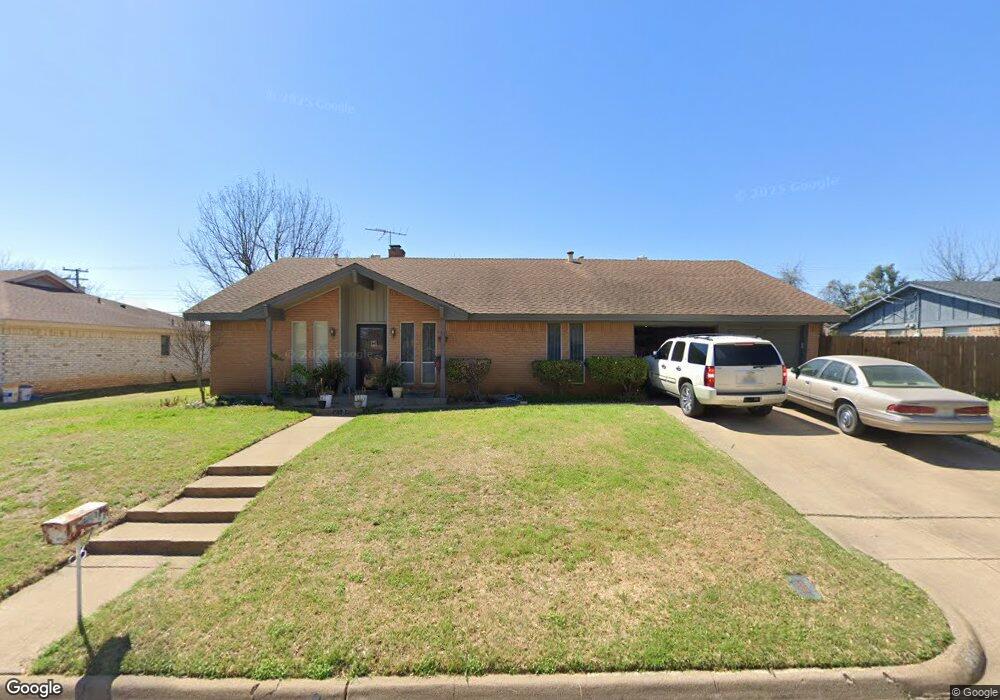
This home is located at 213 Cooper Dr, Hurst, TX 76053 and is currently estimated at $328,930, approximately $176 per square foot. 213 Cooper Dr is a home located in Tarrant County with nearby schools including Jack C Binion Elementary School, Richland Middle School, and Birdville High School.
Ownership History
Date
Name
Owned For
Owner Type
Purchase Details
Closed on
Jun 30, 2021
Sold by
Hansard Ronnie Charles
Bought by
Hansard Ronnie Christopher
Current Estimated Value
Home Financials for this Owner
Home Financials are based on the most recent Mortgage that was taken out on this home.
Original Mortgage
$155,000
Outstanding Balance
$140,638
Interest Rate
2.9%
Mortgage Type
New Conventional
Estimated Equity
$188,292
Purchase Details
Closed on
Aug 25, 2015
Sold by
Hansard Virginia and Hansard Virginia Willow Dean
Bought by
Hansard Ronnie Charles
Create a Home Valuation Report for This Property
The Home Valuation Report is an in-depth analysis detailing your home's value as well as a comparison with similar homes in the area
Home Values in the Area
Average Home Value in this Area
Purchase History
| Date | Buyer | Sale Price | Title Company |
|---|---|---|---|
| Hansard Ronnie Christopher | -- | Lawyers Title | |
| Hansard Ronnie Charles | $65,000 | None Available |
Source: Public Records
Mortgage History
| Date | Status | Borrower | Loan Amount |
|---|---|---|---|
| Open | Hansard Ronnie Christopher | $155,000 |
Source: Public Records
Tax History
| Year | Tax Paid | Tax Assessment Tax Assessment Total Assessment is a certain percentage of the fair market value that is determined by local assessors to be the total taxable value of land and additions on the property. | Land | Improvement |
|---|---|---|---|---|
| 2025 | $3,651 | $233,462 | $66,580 | $166,882 |
| 2024 | $3,651 | $233,462 | $66,580 | $166,882 |
| 2023 | $5,327 | $238,454 | $55,264 | $183,190 |
| 2022 | $5,239 | $211,880 | $55,202 | $156,678 |
| 2021 | $4,924 | $189,799 | $50,000 | $139,799 |
| 2020 | $5,318 | $215,508 | $50,000 | $165,508 |
| 2019 | $4,945 | $225,387 | $50,000 | $175,387 |
| 2018 | $1,074 | $171,034 | $25,000 | $146,034 |
| 2017 | $4,149 | $175,774 | $25,000 | $150,774 |
| 2016 | $3,772 | $170,129 | $25,000 | $145,129 |
| 2015 | $1,127 | $128,500 | $20,000 | $108,500 |
| 2014 | $1,127 | $128,500 | $20,000 | $108,500 |
Source: Public Records
Map
Nearby Homes
- 116 Cooper Dr
- 1228 W Hurst Blvd
- 1213 Walker Dr
- 1204 Crestview Dr
- 1208 Harris Ave
- 7620 Brooks Ave
- 8228 Fall Crest Dr
- 549 Greenwood Cir
- 7515 Evelyn Dr
- 420 Twin Creek Dr
- 609 Melbourne Rd
- 7436 Bridges Ave
- 612 Melbourne Ct
- 632 Melbourne Ct
- 3617 Granada Dr
- 3608 Labadie Dr
- 3616 Labadie Dr
- 3705 Granada Dr
- 8317 Whistling Duck Dr
- 3800 Oxley Dr
Your Personal Tour Guide
Ask me questions while you tour the home.