Estimated Value: $128,000 - $173,323
3
Beds
1
Bath
1,357
Sq Ft
$112/Sq Ft
Est. Value
About This Home
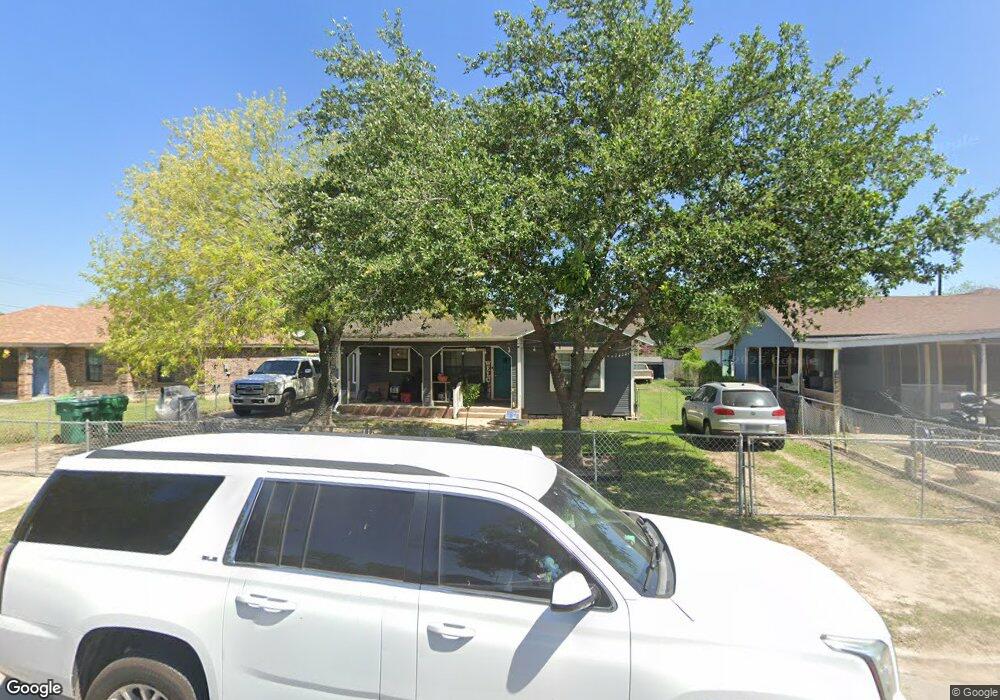
This home is located at 213 E Emil St, Pharr, TX 78577 and is currently estimated at $152,108, approximately $112 per square foot. 213 E Emil St is a home located in Hidalgo County with nearby schools including Raul Longoria Elementary School, Lyndon B. Johnson Middle School, and PSJA North Early College High School.
Ownership History
Date
Name
Owned For
Owner Type
Purchase Details
Closed on
May 7, 2016
Sold by
Longoria Maximiliano and Longoria Cynthia
Bought by
Flores Encarnacion and Flores Maria I
Current Estimated Value
Home Financials for this Owner
Home Financials are based on the most recent Mortgage that was taken out on this home.
Original Mortgage
$52,250
Outstanding Balance
$22,900
Interest Rate
3.71%
Mortgage Type
New Conventional
Estimated Equity
$129,208
Purchase Details
Closed on
Nov 20, 1997
Sold by
Pena Virgilio
Bought by
Delagarza Roel and Delagarza Octavia
Purchase Details
Closed on
Nov 10, 1997
Sold by
Pena Sonia Maria
Bought by
Pena Virgilio
Purchase Details
Closed on
Sep 16, 1997
Sold by
Pena Christopher
Bought by
Pena Virgilio
Create a Home Valuation Report for This Property
The Home Valuation Report is an in-depth analysis detailing your home's value as well as a comparison with similar homes in the area
Home Values in the Area
Average Home Value in this Area
Purchase History
| Date | Buyer | Sale Price | Title Company |
|---|---|---|---|
| Flores Encarnacion | -- | Valley Land Title Co | |
| Delagarza Roel | -- | -- | |
| Pena Virgilio | -- | -- | |
| Pena Virgilio | -- | -- | |
| Pena Virgilio | -- | -- |
Source: Public Records
Mortgage History
| Date | Status | Borrower | Loan Amount |
|---|---|---|---|
| Open | Flores Encarnacion | $52,250 |
Source: Public Records
Tax History
| Year | Tax Paid | Tax Assessment Tax Assessment Total Assessment is a certain percentage of the fair market value that is determined by local assessors to be the total taxable value of land and additions on the property. | Land | Improvement |
|---|---|---|---|---|
| 2025 | $3,255 | $144,611 | $56,056 | $88,555 |
| 2024 | $3,255 | $129,887 | $50,960 | $78,927 |
| 2023 | $2,711 | $101,143 | $50,960 | $50,183 |
| 2022 | $2,837 | $101,143 | $27,755 | $73,388 |
| 2021 | $2,502 | $87,583 | $27,755 | $59,828 |
| 2020 | $2,335 | $80,716 | $27,755 | $52,961 |
| 2019 | $1,628 | $55,556 | $18,200 | $37,356 |
| 2018 | $1,659 | $56,298 | $18,200 | $38,098 |
| 2017 | $1,718 | $57,783 | $18,200 | $39,583 |
| 2016 | $1,487 | $50,030 | $18,200 | $31,830 |
| 2015 | $1,559 | $51,210 | $18,200 | $33,010 |
Source: Public Records
Map
Nearby Homes
- 1701 N Ebony St
- 2016 N Cage Blvd
- 207 E Diaz Ave
- 304 & 306 E Polk Ave
- 5704 N Ebony St
- 00 E Ferguson Ave
- 921 E Alan St
- 204 W Eller Ave
- 2400 S Cage Blvd
- 218 W Eller Ave
- 1007 E Bagwell St
- 809 E Ferguson St
- 905 E Brady Cir
- 1010 E Bagwell St
- 912 E Brady Cir
- 1909 N Gumwood St
- 903 E San Antonio Ave
- 315 W Eller Ave
- 813 E Villegas Ave
- 4713 N Juniper St
Your Personal Tour Guide
Ask me questions while you tour the home.