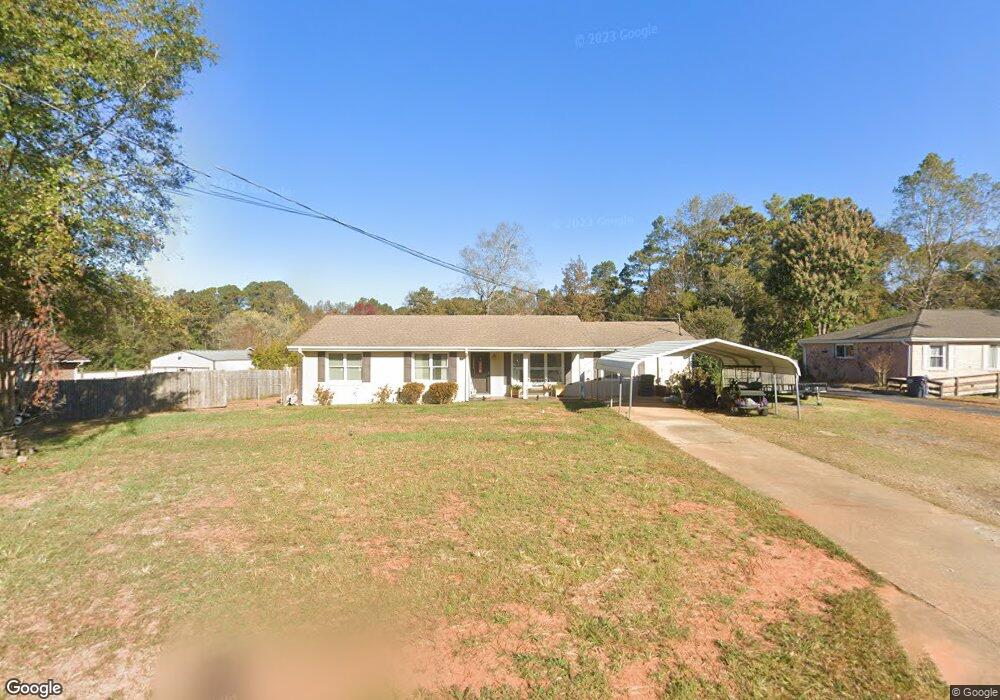
213 E Lakeview Dr Lagrange, GA 30240
Estimated Value: $230,742 - $273,000
3
Beds
2
Baths
1,662
Sq Ft
$147/Sq Ft
Est. Value
About This Home
This home is located at 213 E Lakeview Dr, Lagrange, GA 30240 and is currently estimated at $244,436, approximately $147 per square foot. 213 E Lakeview Dr is a home located in Troup County with nearby schools including Ethel W. Kight Elementary School, Hollis Hand Elementary School, and Franklin Forest Elementary School.
Ownership History
Date
Name
Owned For
Owner Type
Purchase Details
Closed on
Sep 23, 2014
Sold by
Tucker Karen
Bought by
Tucker Karen and Tucker Ricky
Current Estimated Value
Purchase Details
Closed on
Nov 18, 2000
Sold by
Talley Karen B
Bought by
Tucker Karen and Tucker Ricky
Purchase Details
Closed on
Oct 17, 1996
Sold by
Anthont C Ivey
Bought by
Talley Karen B
Purchase Details
Closed on
Jul 10, 1996
Sold by
John F Talley
Bought by
Anthont C Ivey
Purchase Details
Closed on
Jun 14, 1996
Sold by
Karen Karen B and Karen B
Bought by
John F Talley
Purchase Details
Closed on
Mar 6, 1990
Sold by
Margaret Rosenheim S Chase
Bought by
Karen Karen B and Karen B
Purchase Details
Closed on
Aug 20, 1974
Sold by
Butts Butts J and Butts Humphries C
Bought by
Margaret Rosenheim S Chase
Purchase Details
Closed on
Jan 1, 1966
Sold by
Sims H E
Create a Home Valuation Report for This Property
The Home Valuation Report is an in-depth analysis detailing your home's value as well as a comparison with similar homes in the area
Purchase History
| Date | Buyer | Sale Price | Title Company |
|---|---|---|---|
| Tucker Karen | -- | -- | |
| Tucker Karen | -- | -- | |
| Talley Karen B | -- | -- | |
| Anthont C Ivey | -- | -- | |
| John F Talley | -- | -- | |
| Karen Karen B | $57,000 | -- | |
| Margaret Rosenheim S Chase | -- | -- | |
| -- | -- | -- | |
| Butts Butts J | -- | -- |
Source: Public Records
Tax History
| Year | Tax Paid | Tax Assessment Tax Assessment Total Assessment is a certain percentage of the fair market value that is determined by local assessors to be the total taxable value of land and additions on the property. | Land | Improvement |
|---|---|---|---|---|
| 2025 | $1,645 | $77,708 | $10,000 | $67,708 |
| 2024 | $1,275 | $56,688 | $10,000 | $46,688 |
| 2023 | $1,221 | $54,700 | $10,000 | $44,700 |
| 2022 | $1,183 | $52,340 | $10,000 | $42,340 |
| 2021 | $1,077 | $45,660 | $10,000 | $35,660 |
| 2020 | $957 | $41,660 | $6,000 | $35,660 |
| 2019 | $951 | $41,488 | $6,000 | $35,488 |
| 2018 | $791 | $36,168 | $5,000 | $31,168 |
| 2017 | $945 | $33,328 | $5,000 | $28,328 |
| 2016 | $919 | $32,448 | $5,000 | $27,448 |
| 2015 | $938 | $33,015 | $5,000 | $28,015 |
| 2014 | $895 | $31,540 | $5,000 | $26,540 |
| 2013 | -- | $32,704 | $5,000 | $27,704 |
Source: Public Records
Map
Nearby Homes
- 223 Pinehaven Dr
- 3 Reed Dr
- 0 Unit 10514554
- 117 Brookwood Dr
- 336 Whitaker Rd
- 104 Spring Valley Dr
- 641 Whitaker Rd
- 200 Cheyenne Dr
- 427 Fling Rd
- 8 Horace Carter Rd
- 203 Shawnee Dr
- 0 Bradfield Dr Unit 10568803
- 509 Connie Dr
- 0 Hills and Dales Farm Rd
- 214 Willowcrest Way
- 217 Highland Trail
- 808 S Fling Rd
- 101 Crown St Unit LOT 5
- 102 Crown St Unit LOT 1
- 107 Clark St
- 215 E Lakeview Dr
- 212 W Lakeview Dr
- 214 W Lakeview Dr
- 216 W Lakeview Dr
- 217 E Lakeview Dr
- 206 E Lakeview Dr
- 204 E Lakeview Dr
- 210 W Lakeview Dr
- 222 E Lakeview Dr
- 218 W Lakeview Dr
- 247 E Lakeview Dr
- 213 W Lakeview Dr
- 211 W Lakeview Dr
- 215 W Lakeview Dr
- 207 W Lakeview Dr
- 224 E Lakeview Dr
- 217 W Lakeview Dr
- 208 W Lakeview Dr
- 219 W Lakeview Dr
- 226 E Lakeview Dr
Your Personal Tour Guide
Ask me questions while you tour the home.