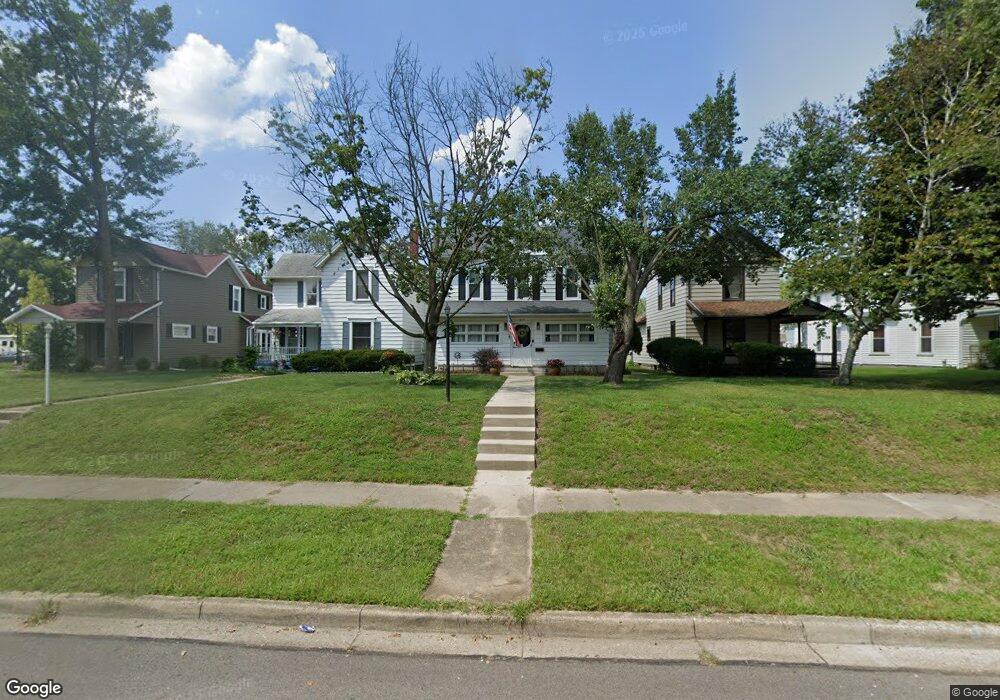
213 E Main St West Carrollton, OH 45449
Estimated Value: $176,143 - $186,000
3
Beds
2
Baths
1,832
Sq Ft
$98/Sq Ft
Est. Value
About This Home
This home is located at 213 E Main St, West Carrollton, OH 45449 and is currently estimated at $179,286, approximately $97 per square foot. 213 E Main St is a home located in Montgomery County with nearby schools including West Carrollton High School, Miami Valley Academies, and Bethel Baptist School.
Ownership History
Date
Name
Owned For
Owner Type
Purchase Details
Closed on
May 14, 2002
Sold by
Brassington Terry K and Brassington Lorraine A
Bought by
Brassington Lorraine A
Current Estimated Value
Home Financials for this Owner
Home Financials are based on the most recent Mortgage that was taken out on this home.
Original Mortgage
$92,000
Interest Rate
7%
Create a Home Valuation Report for This Property
The Home Valuation Report is an in-depth analysis detailing your home's value as well as a comparison with similar homes in the area
Home Values in the Area
Average Home Value in this Area
Purchase History
| Date | Buyer | Sale Price | Title Company |
|---|---|---|---|
| Brassington Lorraine A | -- | -- |
Source: Public Records
Mortgage History
| Date | Status | Borrower | Loan Amount |
|---|---|---|---|
| Closed | Brassington Lorraine A | $92,000 |
Source: Public Records
Tax History Compared to Growth
Tax History
| Year | Tax Paid | Tax Assessment Tax Assessment Total Assessment is a certain percentage of the fair market value that is determined by local assessors to be the total taxable value of land and additions on the property. | Land | Improvement |
|---|---|---|---|---|
| 2024 | $1,953 | $39,350 | $6,570 | $32,780 |
| 2023 | $1,953 | $39,350 | $6,570 | $32,780 |
| 2022 | $1,623 | $27,730 | $4,620 | $23,110 |
| 2021 | $1,625 | $27,730 | $4,620 | $23,110 |
| 2020 | $1,625 | $27,730 | $4,620 | $23,110 |
| 2019 | $1,381 | $23,330 | $4,200 | $19,130 |
| 2018 | $1,303 | $23,330 | $4,200 | $19,130 |
| 2017 | $1,295 | $23,330 | $4,200 | $19,130 |
| 2016 | $1,278 | $22,760 | $4,200 | $18,560 |
| 2015 | $1,186 | $22,760 | $4,200 | $18,560 |
| 2014 | $1,186 | $22,760 | $4,200 | $18,560 |
| 2012 | -- | $34,290 | $5,500 | $28,790 |
Source: Public Records
Map
Nearby Homes
- 305 E Central Ave
- 12 E Main St
- 209 E Cottage Ave
- 21 W Main St
- 405 E Pease Ave
- 410 Cedar St
- 234 E Home Ave
- 203 W Pease Ave Unit 205
- 44 Savoy Ave
- 234 William St
- 201 S Smith St
- 628 Burns Ave
- 340 S Elm St
- 326 Windsor Ct
- 121 E Circle Dr
- 230 Stadium Ave
- 26 Southard Ln
- 626 Upland Dr
- 624 Skyview Dr
- 758 Cransberry Dr