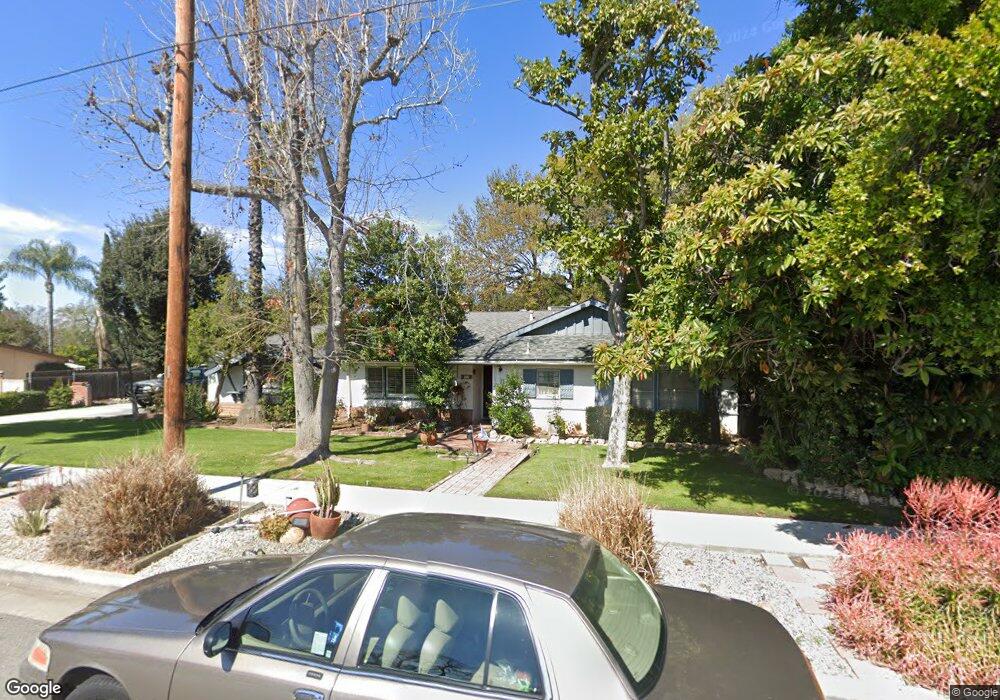
213 E South Ave Redlands, CA 92373
South Redlands NeighborhoodEstimated Value: $761,000 - $1,022,000
4
Beds
2
Baths
2,416
Sq Ft
$360/Sq Ft
Est. Value
About This Home
This home is located at 213 E South Ave, Redlands, CA 92373 and is currently estimated at $869,942, approximately $360 per square foot. 213 E South Ave is a home located in San Bernardino County with nearby schools including Kimberly Elementary School, Moore Middle School, and Redlands Senior High School.
Ownership History
Date
Name
Owned For
Owner Type
Purchase Details
Closed on
Nov 19, 2014
Sold by
Overgaag Richard H
Bought by
Jo Richard H Overgaag and Jo Nancy G Overgaag
Current Estimated Value
Home Financials for this Owner
Home Financials are based on the most recent Mortgage that was taken out on this home.
Original Mortgage
$106,000
Interest Rate
4.1%
Mortgage Type
New Conventional
Purchase Details
Closed on
Nov 24, 2004
Sold by
Overgaag Richard H
Bought by
Overgaag Richard H and Overgaag Nancy G
Create a Home Valuation Report for This Property
The Home Valuation Report is an in-depth analysis detailing your home's value as well as a comparison with similar homes in the area
Home Values in the Area
Average Home Value in this Area
Purchase History
| Date | Buyer | Sale Price | Title Company |
|---|---|---|---|
| Jo Richard H Overgaag | -- | Lawyers Title | |
| Overgaag Richard H | -- | Lawyers Title | |
| Overgaag Richard H | -- | -- |
Source: Public Records
Mortgage History
| Date | Status | Borrower | Loan Amount |
|---|---|---|---|
| Closed | Overgaag Richard H | $106,000 |
Source: Public Records
Tax History
| Year | Tax Paid | Tax Assessment Tax Assessment Total Assessment is a certain percentage of the fair market value that is determined by local assessors to be the total taxable value of land and additions on the property. | Land | Improvement |
|---|---|---|---|---|
| 2025 | $3,805 | $304,612 | $58,570 | $246,042 |
| 2024 | $3,554 | $298,640 | $57,422 | $241,218 |
| 2023 | $3,550 | $292,784 | $56,296 | $236,488 |
| 2022 | $3,498 | $287,043 | $55,192 | $231,851 |
| 2021 | $3,562 | $281,415 | $54,110 | $227,305 |
| 2020 | $3,509 | $278,529 | $53,555 | $224,974 |
| 2019 | $3,411 | $273,068 | $52,505 | $220,563 |
| 2018 | $3,327 | $267,713 | $51,475 | $216,238 |
| 2017 | $3,299 | $262,464 | $50,466 | $211,998 |
| 2016 | $3,262 | $257,317 | $49,476 | $207,841 |
| 2015 | $3,238 | $253,452 | $48,733 | $204,719 |
| 2014 | $3,180 | $248,487 | $47,778 | $200,709 |
Source: Public Records
Map
Nearby Homes
- 1514 Franklin Ave
- 225 Sunset Dr
- 1388 Brandon Ct
- 1525 Garden St
- 1641 Ford St
- 1617 Garden St
- 1370 Oak St
- 0 Garden St Unit EV23054640
- 512 Golden West Dr
- 505 E Sunset Dr N
- 116 Franklin Ave
- 533 Via Vista Dr
- 503 Camino Real
- 1702 Dwight St
- 0 Campbell Ave
- 1550 Marion Rd
- 1377 Knoll Rd
- 1400 Elizabeth St
- 529 Manzanita Rd
- 745 W Sunset Dr
- 209 E South Ave
- 214 Belmont Ct
- 210 Belmont Ct
- 218 Belmont Ct
- 212 E South Ave
- 205 E South Ave
- 221 E South Ave
- 216 E South Ave
- 208 E South Ave
- 206 Belmont Ct
- 222 Belmont Ct
- 220 E South Ave
- 1516 Lynne Ct
- 204 E South Ave
- 1513 Lynne Ct
- 201 E South Ave
- 1518 Lynne Ct
- 215 Belmont Ct
- 219 Belmont Ct
- 202 Belmont Ct
Your Personal Tour Guide
Ask me questions while you tour the home.