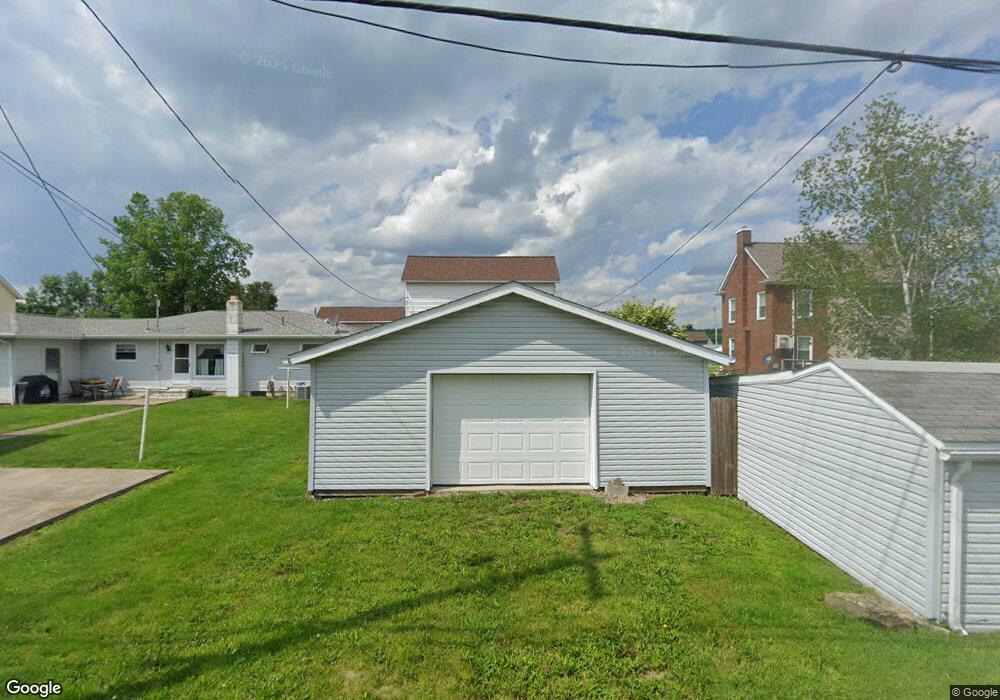
213 Euclid Ave Byesville, OH 43723
Estimated Value: $154,241 - $169,000
3
Beds
1
Bath
1,456
Sq Ft
$109/Sq Ft
Est. Value
About This Home
This home is located at 213 Euclid Ave, Byesville, OH 43723 and is currently estimated at $158,810, approximately $109 per square foot. 213 Euclid Ave is a home located in Guernsey County with nearby schools including Meadowbrook High School, Foxfire East Academy, and Cherish Christian Academy.
Ownership History
Date
Name
Owned For
Owner Type
Purchase Details
Closed on
Jun 8, 2018
Sold by
Duran Cesar David and Duran Kayla A
Bought by
Bailey Josh A
Current Estimated Value
Home Financials for this Owner
Home Financials are based on the most recent Mortgage that was taken out on this home.
Original Mortgage
$84,442
Outstanding Balance
$72,880
Interest Rate
4.87%
Mortgage Type
FHA
Estimated Equity
$85,930
Purchase Details
Closed on
Jun 14, 2010
Sold by
Durst Donald M and Durst Angela Sue
Bought by
Duran Cesar David
Home Financials for this Owner
Home Financials are based on the most recent Mortgage that was taken out on this home.
Original Mortgage
$78,320
Interest Rate
4.97%
Mortgage Type
USDA
Purchase Details
Closed on
Apr 28, 2009
Sold by
Homesales Inc
Bought by
Durst Donald M and Durst Angela Sue
Purchase Details
Closed on
May 22, 2008
Sold by
Jackson Brian C and Jackson Angela R
Bought by
Homesales Inc
Create a Home Valuation Report for This Property
The Home Valuation Report is an in-depth analysis detailing your home's value as well as a comparison with similar homes in the area
Purchase History
| Date | Buyer | Sale Price | Title Company |
|---|---|---|---|
| Bailey Josh A | $86,000 | Mid Ohio Title Agency | |
| Duran Cesar David | -- | -- | |
| Durst Donald M | $40,000 | -- | |
| Homesales Inc | $54,000 | -- |
Source: Public Records
Mortgage History
| Date | Status | Borrower | Loan Amount |
|---|---|---|---|
| Open | Bailey Josh A | $84,442 | |
| Previous Owner | Duran Cesar David | $78,320 |
Source: Public Records
Tax History
| Year | Tax Paid | Tax Assessment Tax Assessment Total Assessment is a certain percentage of the fair market value that is determined by local assessors to be the total taxable value of land and additions on the property. | Land | Improvement |
|---|---|---|---|---|
| 2025 | $1,386 | $35,056 | $3,311 | $31,745 |
| 2024 | $1,388 | $35,056 | $3,311 | $31,745 |
| 2023 | $1,342 | $27,824 | $2,628 | $25,196 |
| 2022 | $1,158 | $27,830 | $2,630 | $25,200 |
| 2021 | $1,113 | $27,830 | $2,630 | $25,200 |
| 2020 | $1,014 | $25,740 | $2,630 | $23,110 |
| 2019 | $1,006 | $25,740 | $2,630 | $23,110 |
| 2018 | $489 | $25,740 | $2,630 | $23,110 |
| 2017 | $907 | $22,320 | $2,290 | $20,030 |
| 2016 | $894 | $22,320 | $2,290 | $20,030 |
| 2015 | $894 | $22,320 | $2,290 | $20,030 |
| 2014 | -- | $21,260 | $2,080 | $19,180 |
| 2013 | $935 | $21,260 | $2,080 | $19,180 |
Source: Public Records
Map
Nearby Homes
- 0 Greendale Ave
- 237 S 5th St
- 226 S 6th St
- 210 S 4th St
- 0 Main St
- 0 S 9th St
- 208 Meek Ave
- 59528 Vocational Rd
- 132 N 10th St
- 11275 Ideal Rd
- 9585 Country Club Estate Dr
- 0 Country Club Estate Dr Unit 5177842
- 0 Country Club Estate Dr Unit 5177851
- 0 Country Club Estate Dr Unit 5177854
- 0 Country Club Estate Dr Unit 5177868
- 0 Country Club Estate Dr Unit 5177846
- 0 Country Club Estate Dr Unit 5177860
- 0 Country Club Estate Dr Unit 5177843
- 9545 Country Club Estate Dr
- 0 Country Club Estate Dr Unit 5177862
- 211 Euclid Ave
- 215 Euclid Ave
- 214 Mclaughlin Ave
- 217 Euclid Ave
- 212 Mc Laughlin Ave
- 209 Euclid Ave
- 210 Mclaughlin Ave
- 218 Mclaughlin Ave
- 216 Euclid Ave
- 207 Euclid Ave
- 212 Euclid Ave
- 220 Mc Laughlin Ave
- 210 Euclid Ave
- 218 Euclid Ave
- 205 Euclid Ave
- 221 Euclid Ave
- 206 Mclaughlin Ave
- 207 Mclaughlin Ave
- 208 Euclid Ave
- 220 Euclid Ave
Your Personal Tour Guide
Ask me questions while you tour the home.