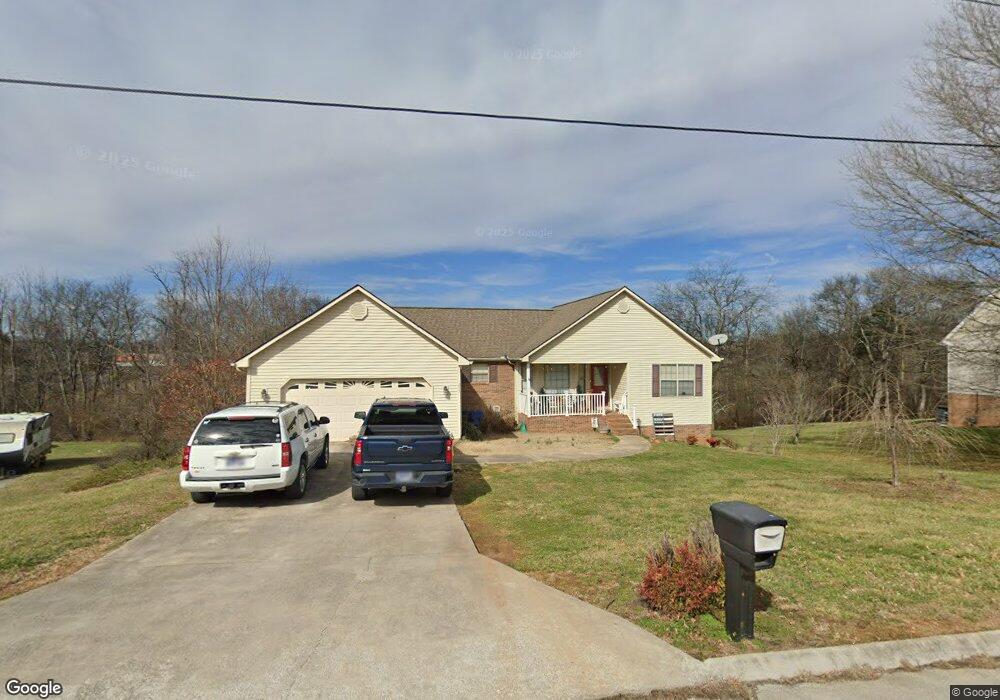
213 Fieldcrest Dr Jefferson City, TN 37760
Estimated Value: $380,736 - $458,000
4
Beds
2
Baths
3,041
Sq Ft
$141/Sq Ft
Est. Value
About This Home
This home is located at 213 Fieldcrest Dr, Jefferson City, TN 37760 and is currently estimated at $428,184, approximately $140 per square foot. 213 Fieldcrest Dr is a home located in Jefferson County with nearby schools including Heritage Christian Academy.
Ownership History
Date
Name
Owned For
Owner Type
Purchase Details
Closed on
Jul 8, 2008
Sold by
Noe Brandon S
Bought by
Woods Jeffrey L
Current Estimated Value
Home Financials for this Owner
Home Financials are based on the most recent Mortgage that was taken out on this home.
Original Mortgage
$206,755
Outstanding Balance
$134,730
Interest Rate
6.27%
Estimated Equity
$293,454
Purchase Details
Closed on
Jun 5, 2006
Sold by
Shepherd Daniel C
Bought by
Noe Brandon S
Home Financials for this Owner
Home Financials are based on the most recent Mortgage that was taken out on this home.
Original Mortgage
$143,900
Interest Rate
6.51%
Purchase Details
Closed on
Jan 13, 2000
Sold by
Johnson Rural F
Bought by
Ralph Johnson
Purchase Details
Closed on
Dec 13, 1999
Sold by
Johnson Rural F
Bought by
Daniel Shepherd
Purchase Details
Closed on
Dec 18, 1997
Bought by
Randall Frankie and Randall Janice
Purchase Details
Closed on
Jul 1, 1997
Bought by
Cain James D and Cain Sharon
Create a Home Valuation Report for This Property
The Home Valuation Report is an in-depth analysis detailing your home's value as well as a comparison with similar homes in the area
Home Values in the Area
Average Home Value in this Area
Purchase History
| Date | Buyer | Sale Price | Title Company |
|---|---|---|---|
| Woods Jeffrey L | $210,000 | -- | |
| Noe Brandon S | $179,900 | -- | |
| Ralph Johnson | $15,000 | -- | |
| Daniel Shepherd | $134,000 | -- | |
| Randall Frankie | $129,000 | -- | |
| Cain James D | $16,000 | -- |
Source: Public Records
Mortgage History
| Date | Status | Borrower | Loan Amount |
|---|---|---|---|
| Open | Cain James D | $206,755 | |
| Previous Owner | Cain James D | $143,900 |
Source: Public Records
Tax History Compared to Growth
Tax History
| Year | Tax Paid | Tax Assessment Tax Assessment Total Assessment is a certain percentage of the fair market value that is determined by local assessors to be the total taxable value of land and additions on the property. | Land | Improvement |
|---|---|---|---|---|
| 2025 | $1,050 | $87,475 | $12,500 | $74,975 |
| 2023 | $1,730 | $49,450 | $0 | $0 |
| 2022 | $1,676 | $49,450 | $7,000 | $42,450 |
| 2021 | $1,676 | $49,450 | $7,000 | $42,450 |
| 2020 | $1,676 | $49,450 | $7,000 | $42,450 |
| 2019 | $1,676 | $49,450 | $7,000 | $42,450 |
| 2018 | $1,629 | $45,875 | $5,750 | $40,125 |
| 2017 | $1,629 | $45,875 | $5,750 | $40,125 |
| 2016 | $1,629 | $45,875 | $5,750 | $40,125 |
| 2015 | $1,606 | $45,875 | $5,750 | $40,125 |
| 2014 | $1,583 | $45,875 | $5,750 | $40,125 |
Source: Public Records
Map
Nearby Homes
- 230 Fieldcrest Dr
- 1366 Clinch View Cir
- 431 Clearbrook Dr
- Parcel 086 N Chucky Pike
- 409 Clearbrook Dr
- 1819 Brookline Ct
- 664 Oxford Rd
- 1211 Debrex Dr
- 1202 Deer Ln
- 228 Newman Cir
- 213 Newman Cir
- 1003 Battle Ridge
- 902 N College St
- 1015 Battle Ridge
- 1004 Battle Ridge
- Cabral Plan at Battle Ridge
- Macon Plan at Battle Ridge
- Aria Plan at Battle Ridge
- Sullivan Plan at Battle Ridge
- Freeport Plan at Battle Ridge
- 209 Fieldcrest Dr
- 217 Fieldcrest Dr
- 226 Fieldcrest Dr
- 103 Sunridge Dr
- 205 Fieldcrest Dr
- 210 Fieldcrest Dr
- 221 Fieldcrest Dr
- 104 Sunridge Dr
- 201 Fieldcrest Dr
- 225 Fieldcrest Dr
- 1254 Clinch View Cir
- 1271 Clinch View Cir
- 1273 Clinch View Cir
- 1286 Clinch View Cir
- 1286 Fieldcrest Dr
- 1267 Clinch View Cir
- 1279 Clinch View Cir
- 1263 Clinch View Cir
- 1287 Clinch View Cir
- 1248 Clinch View Cir