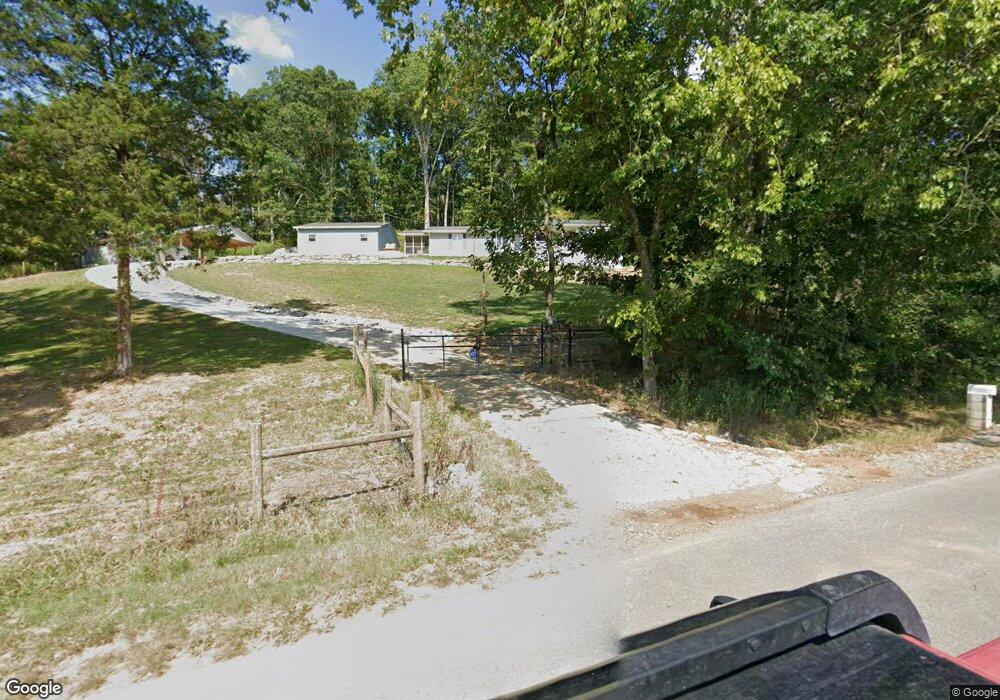
213 Kelly Creek Rd Ardmore, TN 38449
Estimated Value: $326,000 - $483,000
--
Bed
2
Baths
2,292
Sq Ft
$171/Sq Ft
Est. Value
About This Home
This home is located at 213 Kelly Creek Rd, Ardmore, TN 38449 and is currently estimated at $392,000, approximately $171 per square foot. 213 Kelly Creek Rd is a home located in Lincoln County with nearby schools including Blanche School, Lincoln Central Academy, and Lincoln County High School.
Ownership History
Date
Name
Owned For
Owner Type
Purchase Details
Closed on
Aug 8, 2014
Sold by
Sprinkle Charles E
Bought by
Taylor Christopher B and Taylor Meredith L
Current Estimated Value
Purchase Details
Closed on
Sep 14, 2011
Sold by
Wood Rusty C
Bought by
Nichol Thomas J and C/O Rusty C Wood
Purchase Details
Closed on
May 5, 2005
Sold by
Kenneth Land
Bought by
Rusty Wood
Purchase Details
Closed on
Oct 22, 2004
Sold by
Kenneth Land
Bought by
Thomas Nichol
Home Financials for this Owner
Home Financials are based on the most recent Mortgage that was taken out on this home.
Original Mortgage
$178,762
Interest Rate
5.64%
Purchase Details
Closed on
Oct 24, 1991
Sold by
Nichol Thomas J
Bought by
Land Kenneth L
Purchase Details
Closed on
Jun 10, 1983
Sold by
Nichol Thomas J
Bought by
Roach Paul Warren
Purchase Details
Closed on
Oct 18, 1976
Sold by
Nichol Thomas J
Bought by
Holt James
Create a Home Valuation Report for This Property
The Home Valuation Report is an in-depth analysis detailing your home's value as well as a comparison with similar homes in the area
Home Values in the Area
Average Home Value in this Area
Purchase History
| Date | Buyer | Sale Price | Title Company |
|---|---|---|---|
| Taylor Christopher B | $46,000 | -- | |
| Taylor Christopher B | $46,000 | -- | |
| Nichol Thomas J | $29,000 | -- | |
| Nichol Thomas J | $29,000 | -- | |
| Rusty Wood | $24,300 | -- | |
| Thomas Nichol | $175,000 | -- | |
| Thomas Nichol | $175,000 | -- | |
| Land Kenneth L | $88,600 | -- | |
| Land Kenneth L | $88,600 | -- | |
| Roach Paul Warren | $3,000 | -- | |
| Roach Paul Warren | $3,000 | -- | |
| Holt James | $11,000 | -- | |
| Holt James | $11,000 | -- |
Source: Public Records
Mortgage History
| Date | Status | Borrower | Loan Amount |
|---|---|---|---|
| Previous Owner | Holt James | $178,762 |
Source: Public Records
Tax History Compared to Growth
Tax History
| Year | Tax Paid | Tax Assessment Tax Assessment Total Assessment is a certain percentage of the fair market value that is determined by local assessors to be the total taxable value of land and additions on the property. | Land | Improvement |
|---|---|---|---|---|
| 2025 | $1,035 | $54,500 | $0 | $0 |
| 2024 | $1,035 | $54,500 | $12,450 | $42,050 |
| 2023 | $1,007 | $34,950 | $7,700 | $27,250 |
| 2022 | $735 | $34,950 | $7,700 | $27,250 |
| 2021 | $735 | $34,950 | $7,700 | $27,250 |
| 2020 | $735 | $34,950 | $7,700 | $27,250 |
| 2019 | $735 | $34,950 | $7,700 | $27,250 |
| 2018 | $616 | $24,850 | $5,175 | $19,675 |
| 2017 | $581 | $24,850 | $5,175 | $19,675 |
| 2016 | $581 | $24,850 | $5,175 | $19,675 |
| 2015 | -- | $24,850 | $5,175 | $19,675 |
| 2014 | $487 | $24,850 | $5,175 | $19,675 |
Source: Public Records
Map
Nearby Homes
- 61 Minnie Brown Rd
- 40 Blanche Rd
- 239 Henry Bayless Rd
- 1612 Ardmore Hwy
- 1997 Ardmore Hwy
- 1999 Ardmore Hwy
- 167 Henry Bayless Rd
- 113 Elliot Rd
- 66 Thompson Hollow Rd
- 55 Thompson Hollow Rd
- 809 Lofton Hall Rd
- 0 Old Railroad Bed Rd Unit RTC2941746
- 0 Old Railroad Bed Rd Unit RTC2941749
- 0 Old Railroad Bed Rd Unit RTC2921051
- 2126 Ardmore Hwy
- 123 Jones Rd
- 468 Adams Rd
- 93 Merrill Rd
- 30A Stevenson Rd
- 30acres Stevenson Rd
- 201 Mclemore Rd
- 202 Kelly Creek Rd
- 215 Mclemore Rd Unit 215
- 100 Holland Rd
- 208 Kelly Creek Rd
- 339 Philpot Rd
- 193 Mclemore Rd
- 96 Holland Rd
- 219 Mclemore Rd
- 240 Kelly Creek Rd
- 101 Holland Rd
- 249 Kelly Creek Rd
- 183 Kelly Creek Rd
- 250 Kelly Creek Rd
- 174 Kelly Creek Rd
- 176 Mclemore Rd
- 161 Kelly Creek Rd
- 256 Kelly Creek Rd
- 318 Philpot Rd
- 164 Mclemore Rd