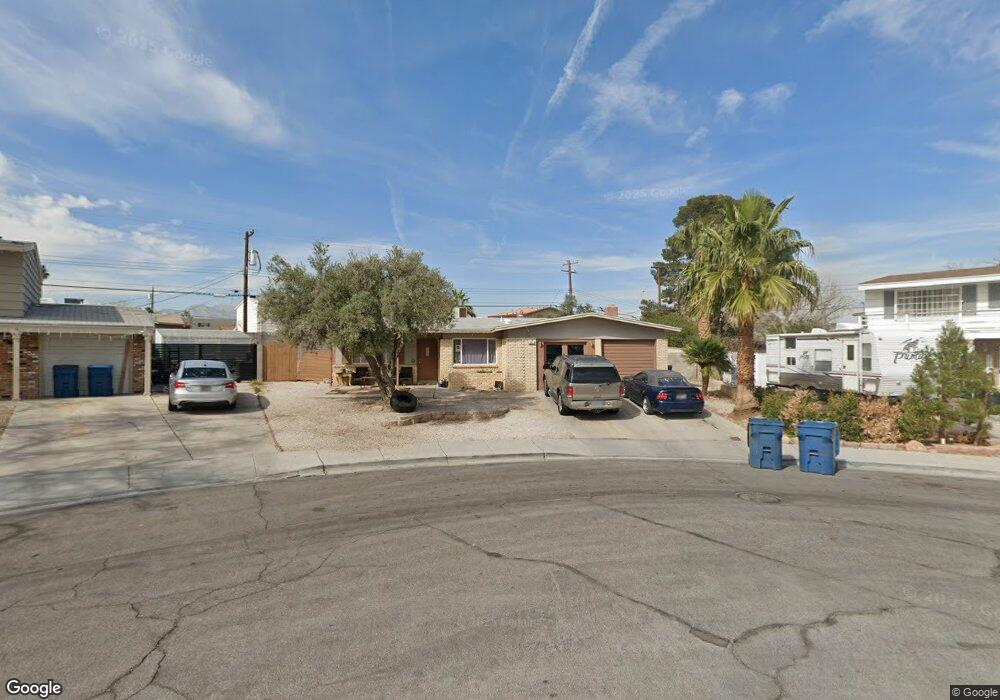
213 Kipling St Las Vegas, NV 89107
Michael Way NeighborhoodEstimated Value: $340,000 - $360,749
3
Beds
2
Baths
1,421
Sq Ft
$247/Sq Ft
Est. Value
About This Home
This home is located at 213 Kipling St, Las Vegas, NV 89107 and is currently estimated at $351,437, approximately $247 per square foot. 213 Kipling St is a home located in Clark County with nearby schools including J.T. McWlliams Elementary School, Robert O Gibson Middle School, and Western High School.
Ownership History
Date
Name
Owned For
Owner Type
Purchase Details
Closed on
Sep 29, 1997
Sold by
Bedford Rita
Bought by
Arroyo John T and Arroyo Voralak
Current Estimated Value
Home Financials for this Owner
Home Financials are based on the most recent Mortgage that was taken out on this home.
Original Mortgage
$94,050
Outstanding Balance
$15,230
Interest Rate
7.54%
Estimated Equity
$336,207
Purchase Details
Closed on
Apr 23, 1997
Sold by
Foreclosure Of Nevada Inc
Bought by
Bedford Rita
Purchase Details
Closed on
Aug 10, 1996
Sold by
Sands Austin L
Bought by
Beckerman Joel
Purchase Details
Closed on
Apr 15, 1996
Sold by
Foreclosures Of Nevada Inc
Bought by
Bedford Rita
Purchase Details
Closed on
Oct 30, 1995
Sold by
Bedford Rita
Bought by
Sands Austin and Sands Ellen
Home Financials for this Owner
Home Financials are based on the most recent Mortgage that was taken out on this home.
Original Mortgage
$25,231
Interest Rate
7.59%
Mortgage Type
Seller Take Back
Create a Home Valuation Report for This Property
The Home Valuation Report is an in-depth analysis detailing your home's value as well as a comparison with similar homes in the area
Home Values in the Area
Average Home Value in this Area
Purchase History
| Date | Buyer | Sale Price | Title Company |
|---|---|---|---|
| Arroyo John T | $99,000 | Lawyers Title | |
| Bedford Rita | $26,743 | -- | |
| Beckerman Joel | -- | -- | |
| Bedford Rita | $29,000 | -- | |
| Sands Austin | $38,000 | Fidelity National Title |
Source: Public Records
Mortgage History
| Date | Status | Borrower | Loan Amount |
|---|---|---|---|
| Open | Arroyo John T | $94,050 | |
| Previous Owner | Sands Austin | $25,231 |
Source: Public Records
Tax History Compared to Growth
Tax History
| Year | Tax Paid | Tax Assessment Tax Assessment Total Assessment is a certain percentage of the fair market value that is determined by local assessors to be the total taxable value of land and additions on the property. | Land | Improvement |
|---|---|---|---|---|
| 2025 | $804 | $52,330 | $31,238 | $21,092 |
| 2024 | $745 | $52,330 | $31,238 | $21,092 |
| 2023 | $745 | $49,555 | $30,503 | $19,052 |
| 2022 | $690 | $43,807 | $26,828 | $16,979 |
| 2021 | $639 | $40,317 | $24,500 | $15,817 |
| 2020 | $590 | $36,353 | $21,000 | $15,353 |
| 2019 | $553 | $32,348 | $17,500 | $14,848 |
| 2018 | $528 | $29,688 | $15,750 | $13,938 |
| 2017 | $969 | $29,562 | $15,750 | $13,812 |
| 2016 | $496 | $24,557 | $11,200 | $13,357 |
| 2015 | $493 | $22,756 | $9,800 | $12,956 |
| 2014 | $479 | $14,174 | $5,250 | $8,924 |
Source: Public Records
Map
Nearby Homes
- 304 Orland St Unit 53
- 304 Orland St Unit 56
- 304 Orland St Unit 39
- 304 Orland St Unit 38
- 304 Orland St Unit 47
- 304 Orland St Unit 43
- 212 Orland St Unit 23
- 212 Orland St Unit 28
- 212 Orland St Unit 22
- 212 Orland St Unit 19
- 212 Orland St Unit 17
- 208 Orland St Unit 10
- 208 Orland St Unit 9
- 204 Orland St Unit 2
- 5620 Roseridge Ave
- 5713 Whiteridge Ave
- 5705 Pearldrop Ave
- 600 Woodmount Dr
- 5612 Pearldrop Ave
- 5420 Moonstruck Ave
- 5608 Morendo Dr
- 209 Kipling St
- 216 Catalini St
- 220 Catalini St
- 220 Catalini St Unit 203
- 220 Catalini St Unit 207
- 220 Catalini St Unit 106
- 220 Catalini St Unit 208
- 220 Catalini St Unit 206
- 220 Catalini St Unit 204
- 220 Catalini St Unit 202
- 220 Catalini St Unit 201
- 220 Catalini St Unit 107
- 220 Catalini St Unit 102
- 220 Catalini St Unit 104
- 220 Catalini St Unit 101
- 220 Catalini St Unit 205
- 220 Catalini St Unit 105
- 220 Catalini St Unit 108
- 220 Catalini St Unit 103