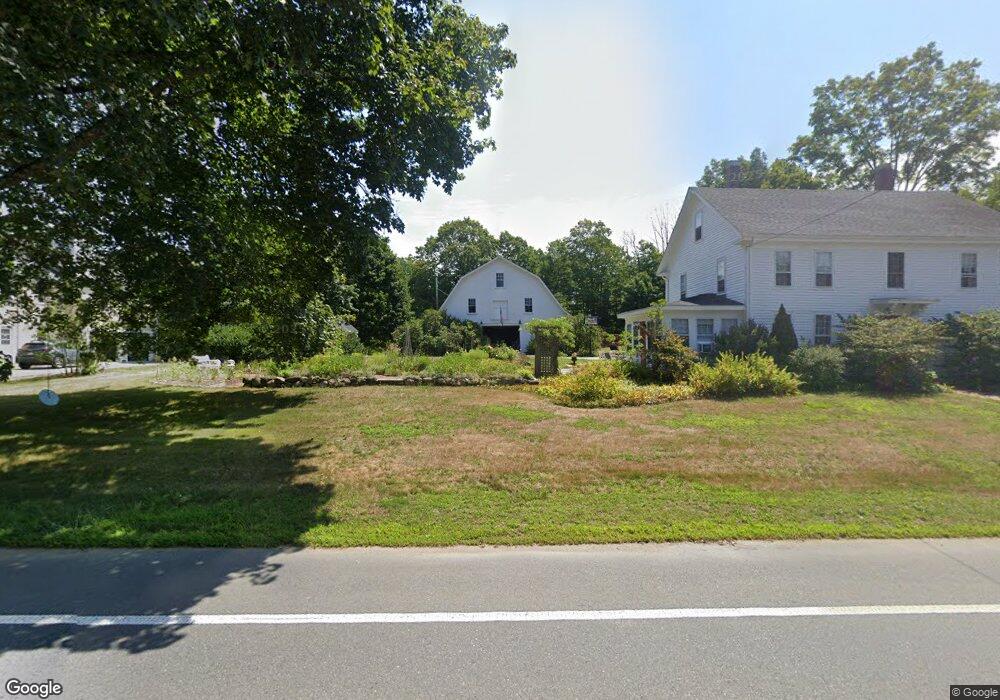
213 Main St West Newbury, MA 01985
Estimated Value: $857,000 - $965,000
4
Beds
2
Baths
2,236
Sq Ft
$408/Sq Ft
Est. Value
About This Home
This home is located at 213 Main St, West Newbury, MA 01985 and is currently estimated at $912,587, approximately $408 per square foot. 213 Main St is a home located in Essex County with nearby schools including Pentucket Regional High School.
Ownership History
Date
Name
Owned For
Owner Type
Purchase Details
Closed on
Mar 6, 2025
Sold by
Friend Amy and Friend Mark S
Bought by
Friend Ft and Friend
Current Estimated Value
Purchase Details
Closed on
Mar 26, 2021
Sold by
Friend Amy and Friend Mark S
Bought by
Friend Amy and Friend Mark S
Purchase Details
Closed on
Sep 29, 2006
Sold by
Joyce O Gadd T
Bought by
Friend Mark S and Friend Amy Beth
Home Financials for this Owner
Home Financials are based on the most recent Mortgage that was taken out on this home.
Original Mortgage
$300,000
Interest Rate
6.52%
Mortgage Type
Purchase Money Mortgage
Create a Home Valuation Report for This Property
The Home Valuation Report is an in-depth analysis detailing your home's value as well as a comparison with similar homes in the area
Home Values in the Area
Average Home Value in this Area
Purchase History
| Date | Buyer | Sale Price | Title Company |
|---|---|---|---|
| Friend Ft | -- | None Available | |
| Friend Ft | -- | None Available | |
| Friend Amy | -- | None Available | |
| Friend Amy | -- | None Available | |
| Friend Mark S | $426,000 | -- | |
| Friend Mark S | $426,000 | -- |
Source: Public Records
Mortgage History
| Date | Status | Borrower | Loan Amount |
|---|---|---|---|
| Previous Owner | Friend Mark S | $355,000 | |
| Previous Owner | Friend Mark S | $305,750 | |
| Previous Owner | Friend Mark S | $300,000 |
Source: Public Records
Tax History Compared to Growth
Tax History
| Year | Tax Paid | Tax Assessment Tax Assessment Total Assessment is a certain percentage of the fair market value that is determined by local assessors to be the total taxable value of land and additions on the property. | Land | Improvement |
|---|---|---|---|---|
| 2025 | $8,502 | $787,200 | $310,600 | $476,600 |
| 2024 | $7,955 | $735,200 | $319,900 | $415,300 |
| 2023 | $7,679 | $696,200 | $308,600 | $387,600 |
| 2022 | $7,500 | $576,500 | $241,800 | $334,700 |
| 2021 | $7,385 | $496,300 | $221,600 | $274,700 |
| 2020 | $7,089 | $491,600 | $221,600 | $270,000 |
| 2019 | $6,679 | $458,400 | $191,400 | $267,000 |
| 2018 | $6,434 | $441,900 | $191,400 | $250,500 |
| 2017 | $5,999 | $412,300 | $185,300 | $227,000 |
| 2016 | $6,032 | $412,300 | $185,300 | $227,000 |
| 2015 | $5,584 | $355,900 | $147,100 | $208,800 |
Source: Public Records
Map
Nearby Homes
- 3 Marshall Dr
- 29 Pleasant St
- 70 Maple St
- 4 Barberry Ln
- 27 Rivercrest Dr
- 31 Rivercrest Dr
- 43 Prospect St
- 4 Stewart St Unit 4
- 20 Albion Ln
- 11 Albion Ln
- 167 Middle St
- 53 Old Amesbury Line Rd
- 22-26 Wood St
- 528 Main St Unit A
- 2 River Rd
- 412 Middle St
- 126 Georgetown Rd
- 0 E Broadway Unit 73335816
- 591 Main St
- 18 River Rd