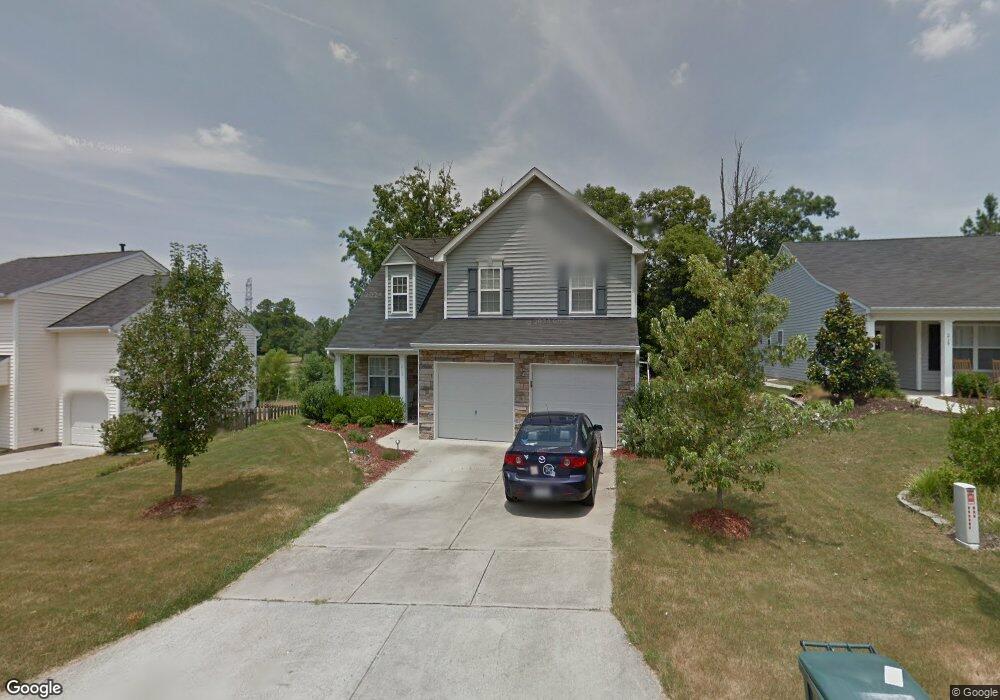
213 Morning View Ct Unit Grove Prk-Lnksd Idle Durham, NC 27703
Eastern Durham NeighborhoodEstimated Value: $368,397 - $401,000
4
Beds
3
Baths
1,743
Sq Ft
$223/Sq Ft
Est. Value
About This Home
This home is located at 213 Morning View Ct Unit Grove Prk-Lnksd Idle, Durham, NC 27703 and is currently estimated at $388,849, approximately $223 per square foot. 213 Morning View Ct Unit Grove Prk-Lnksd Idle is a home located in Durham County with nearby schools including Oak Grove Elementary, John W Neal Middle School, and Southern School of Energy & Sustainability.
Ownership History
Date
Name
Owned For
Owner Type
Purchase Details
Closed on
Aug 30, 2023
Sold by
Unknown
Bought by
Lee Sau Man Heidi
Current Estimated Value
Purchase Details
Closed on
Jul 17, 2023
Sold by
Ox Nathan C C and Ox Ashlea M
Bought by
Lee Heidi
Purchase Details
Closed on
Oct 12, 2018
Sold by
Opendoor Property W33 Llc
Bought by
Cox Nathan C and Riston Ashlea M
Home Financials for this Owner
Home Financials are based on the most recent Mortgage that was taken out on this home.
Original Mortgage
$227,950
Interest Rate
4.6%
Mortgage Type
New Conventional
Purchase Details
Closed on
Aug 13, 2018
Sold by
Lynch Ryan P and Lynch Stephanie R
Bought by
Opendoor Property W33 Llc
Home Financials for this Owner
Home Financials are based on the most recent Mortgage that was taken out on this home.
Original Mortgage
$227,950
Interest Rate
4.6%
Mortgage Type
New Conventional
Create a Home Valuation Report for This Property
The Home Valuation Report is an in-depth analysis detailing your home's value as well as a comparison with similar homes in the area
Home Values in the Area
Average Home Value in this Area
Purchase History
| Date | Buyer | Sale Price | Title Company |
|---|---|---|---|
| Lee Sau Man Heidi | -- | None Listed On Document | |
| Lee Heidi | $390,000 | None Listed On Document | |
| Cox Nathan C | $235,000 | None Available | |
| Opendoor Property W33 Llc | $215,000 | None Available |
Source: Public Records
Mortgage History
| Date | Status | Borrower | Loan Amount |
|---|---|---|---|
| Previous Owner | Cox Nathan C | $227,950 |
Source: Public Records
Tax History Compared to Growth
Tax History
| Year | Tax Paid | Tax Assessment Tax Assessment Total Assessment is a certain percentage of the fair market value that is determined by local assessors to be the total taxable value of land and additions on the property. | Land | Improvement |
|---|---|---|---|---|
| 2025 | $3,805 | $383,890 | $87,000 | $296,890 |
| 2024 | $2,947 | $211,270 | $43,387 | $167,883 |
| 2023 | $2,767 | $211,270 | $43,387 | $167,883 |
| 2022 | $2,704 | $211,270 | $43,387 | $167,883 |
| 2021 | $2,691 | $211,270 | $43,387 | $167,883 |
| 2020 | $2,628 | $211,270 | $43,387 | $167,883 |
| 2019 | $2,628 | $211,270 | $43,387 | $167,883 |
| 2018 | $2,382 | $175,610 | $40,495 | $135,115 |
| 2017 | $2,365 | $175,610 | $40,495 | $135,115 |
| 2016 | $2,285 | $175,610 | $40,495 | $135,115 |
| 2015 | $2,440 | $176,256 | $31,629 | $144,627 |
| 2014 | $2,440 | $176,256 | $31,629 | $144,627 |
Source: Public Records
Map
Nearby Homes
- 210 Stallings Rd
- 1 Thorn Brook Ct
- 2800-2809 Napoli Dr
- 4 Fire Rock Place
- 103 Bermuda Green Dr
- 406 Robbins Rd
- 402 Robbins Rd
- 106 Newberry Ln
- 208 Lick Creek Ln
- 110 Kindlewood Dr
- 5609 Thistlerock Ln
- 2010 Bunchberry Ln
- 10 Autrey Mill Cir
- 1130 Arbor Edge Ln
- 1318 Cosmic Dr
- 5255 Wake Forest Rd
- 4 N Berrymeadow Ln
- 5409 Hadrian Dr
- 2117 Fletchers Ridge Dr
- 204 Hillview Dr
- 213 Morning View Ct
- 215 Morning View Ct
- 211 Morning View Ct
- 209 Morning View Ct
- 217 Morning View Ct
- 209 Morning View Ct
- 212 Morning View Ct
- 214 Morning View Ct
- 207 Morning View Ct
- 219 Morning View Ct
- 210 Morning View Ct
- 216 Morning View Ct
- 208 Morning View Ct
- 205 Morning View Ct
- 205 Morning View Ct
- 218 Morning View Ct
- 218 Morning View Ct
- 206 Morning View Ct
- 221 Morning View Ct
- 220 Morning View Ct