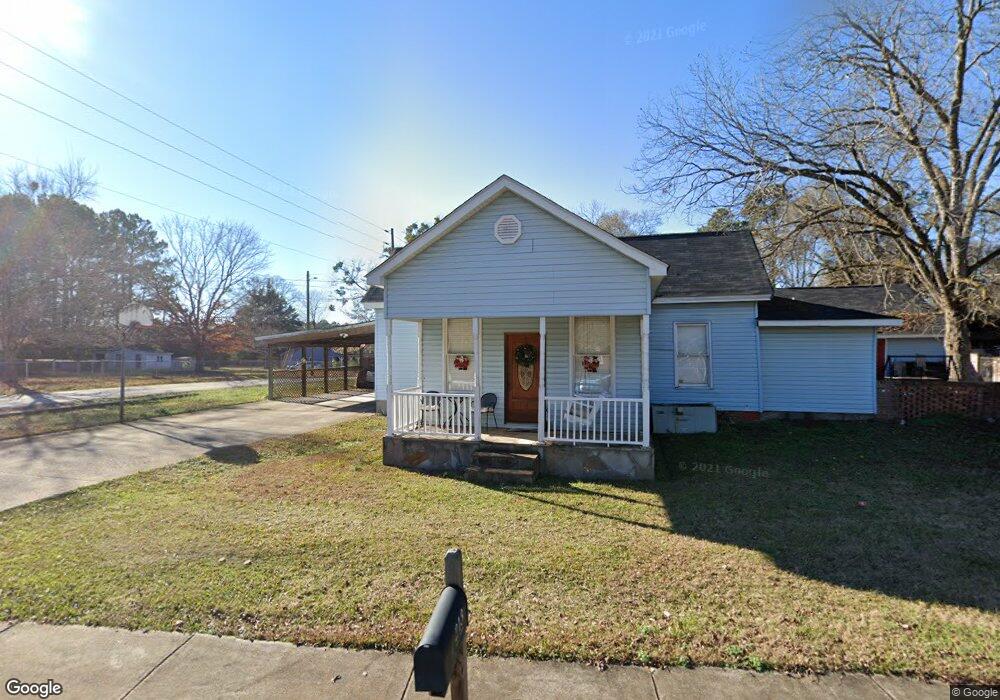
213 N Barnard Ave Lagrange, GA 30241
Estimated Value: $196,000 - $230,000
3
Beds
1
Bath
1,606
Sq Ft
$134/Sq Ft
Est. Value
About This Home
This home is located at 213 N Barnard Ave, Lagrange, GA 30241 and is currently estimated at $215,358, approximately $134 per square foot. 213 N Barnard Ave is a home located in Troup County with nearby schools including Callaway Elementary School, Hogansville Elementary School, and Callaway Middle School.
Ownership History
Date
Name
Owned For
Owner Type
Purchase Details
Closed on
Oct 20, 1998
Sold by
Alford Hand
Bought by
Hand Cathy M
Current Estimated Value
Purchase Details
Closed on
Nov 4, 1997
Sold by
Alford Otis Hand By Tc
Bought by
Alford Hand
Purchase Details
Closed on
Jan 1, 1989
Sold by
Tilton Hollis England
Bought by
Alford Otis Hand By Tc
Purchase Details
Closed on
Dec 1, 1988
Sold by
Otis Ely Hand
Bought by
Tilton Hollis England
Purchase Details
Closed on
May 1, 1988
Sold by
England T H
Bought by
Otis Ely Hand
Purchase Details
Closed on
Dec 27, 1985
Sold by
Hermione Hand
Bought by
England T H
Purchase Details
Closed on
May 7, 1982
Sold by
Loraine Othell and Loraine Knight
Bought by
Hermione Hand
Purchase Details
Closed on
Aug 1, 1981
Sold by
Virtie Sybil
Bought by
Loraine Othell and Loraine Knight
Purchase Details
Closed on
Nov 1, 1968
Bought by
Virtie Sybil
Purchase Details
Closed on
Jan 1, 1935
Create a Home Valuation Report for This Property
The Home Valuation Report is an in-depth analysis detailing your home's value as well as a comparison with similar homes in the area
Home Values in the Area
Average Home Value in this Area
Purchase History
| Date | Buyer | Sale Price | Title Company |
|---|---|---|---|
| Hand Cathy M | -- | -- | |
| Alford Hand | $32,200 | -- | |
| Alford Otis Hand By Tc | -- | -- | |
| Tilton Hollis England | -- | -- | |
| Otis Ely Hand | -- | -- | |
| England T H | -- | -- | |
| Hermione Hand | -- | -- | |
| Loraine Othell | -- | -- | |
| Virtie Sybil | -- | -- | |
| -- | -- | -- |
Source: Public Records
Tax History Compared to Growth
Tax History
| Year | Tax Paid | Tax Assessment Tax Assessment Total Assessment is a certain percentage of the fair market value that is determined by local assessors to be the total taxable value of land and additions on the property. | Land | Improvement |
|---|---|---|---|---|
| 2024 | $1,685 | $63,760 | $11,000 | $52,760 |
| 2023 | $982 | $55,884 | $11,000 | $44,884 |
| 2022 | $1,444 | $53,724 | $11,000 | $42,724 |
| 2021 | $1,302 | $45,156 | $11,000 | $34,156 |
| 2020 | $1,302 | $45,156 | $11,000 | $34,156 |
| 2019 | $1,209 | $42,088 | $9,600 | $32,488 |
| 2018 | $1,209 | $42,088 | $9,600 | $32,488 |
| 2017 | $1,209 | $42,088 | $9,600 | $32,488 |
| 2016 | $1,203 | $41,871 | $9,600 | $32,271 |
| 2015 | $1,248 | $43,298 | $11,028 | $32,271 |
| 2014 | $1,199 | $41,600 | $11,028 | $30,572 |
| 2013 | -- | $42,465 | $11,028 | $31,438 |
Source: Public Records
Map
Nearby Homes
- 105 Lenox Cir
- 101 Lenox Cir
- 305 Lenox Cir
- 0 N Barnard Ave
- 113 Lenox Cir
- 227 River Meadow Dr Unit H14
- 231 River Meadow Dr
- 412 Sweetwood Ct Unit A36
- 130 Clara Jean Ct
- 121 Ct
- 207 Baileys Way
- 509 Youngs Mill Rd
- 793 Celebration Blvd
- 105 Ridgefield Dr
- 113 Woodridge Cir
- 121 Woodridge Cir
- 125 Ridgefield Cir
- 456 Brookstone Dr
- 5 Curran Ave
- 112 Celebration Blvd
- 202 N Barnard Ave
- 115 N Barnard Ave
- 204 N Barnard Ave
- 110 Wood Ave
- 108 Peachtree Ct Unit B
- 108 Peachtree Ct Unit A
- 108 Peachtree Ct Unit A
- 108 Peachtree Ct Unit C
- 113 N Barnard Ave
- 120 N Barnard Ave
- 106 Peachtree Ct
- 210 N Barnard Ave
- 215 N Barnard Ave
- 108 Wood Ave
- 107 Peachtree Ct
- 111 N Barnard Ave
- 116 N Barnard Ave
- 104 Peachtree Ct Unit A
- 104 Peachtree Ct
- 105 Peachtree Ct